| | | Assignment 10 (Due: February 10, 2012, before 01:00pm) |  |
|
+13kevinmendez Alexander Manlod brian flores Joseph Jorge Repaso kenneth jan malubay melissa_carpio Gertrude_R_Cordero Michael S. Palacio viktor immanuel calonia patrickduanevalle annjuviepapas Ailene_Madato Admin 17 posters | | Author | Message |
|---|
Admin
Admin
Posts : 41
Points : 124
Join date : 2009-06-17
 | | Subject: Assignment 10 (Due: February 10, 2012, before 01:00pm) Fri Jan 13, 2012 9:53 am | |
| With reference to assignments 8 and 9, what characteristics does an analyst(you) examine when evalauating DFD quality? (1500 words)
| |
| | | | Ailene_Madato

Posts : 15
Points : 15
Join date : 2011-11-24
Age : 33
Location : Davao City
| | Subject: Re: Assignment 10 (Due: February 10, 2012, before 01:00pm) Thu Feb 09, 2012 3:35 pm | |
| In the last two assignments, we were told to develop an activity diagram and a fully developed explanation for a use case and generate at least 3 different styles of Data flow diagram of USEP's pre-enrollment system, respectively. As part of our next assignment, we were told (as an analyst) to define the characteristics does an analyst examine when evaluating DFD quality. Before discussing thoroughly what was being asked and since not all of us are familiar with data flow diagram, I will define it first, as well as the different notations incorporated with data flow diagram. Data flow diagrams are use to illustrate the different processes integrated in a system. It has inputs and outputs. Those inputs undergo a process or different processes to produce an output or outputs. According to Gane and Sarson, data flow diagrams (DFDs) were established and well-liked for Structured Design Analysis. Data flow diagrams give us idea about the flow of data or information: from the exterior component into the system, then demonstrated how the data stimulated from one process to another plus its logical storage. DATA FLOW DIAGRAM 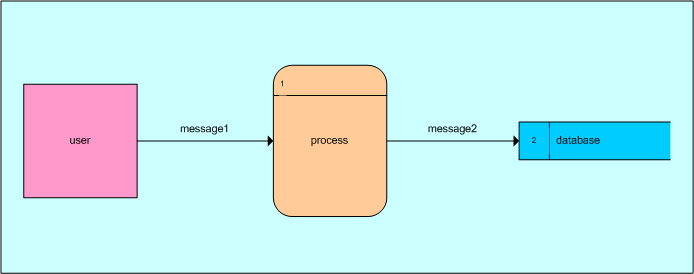 In creating a data flow diagram, there are only four symbols needed. 1) SQUARES – it is used to represent the external components or entities, which are the sources (starting point) or the destinations (end point) of data 2) ROUNDED RECTANGLES – it is used to symbolize the processes: having the data as the input, then doing something to it and produce an output from it. 3) ARROWS - which can either be electronic data or physical items 4) OPEN-ENDED RECTANGLES – it is used to represent the data storage. It includes electronic storage such as databases, and physical storage such as filing cabinets. DATA FLOW DIAGRAM NOTATIONSProcess NotationA process is the action of taking the incoming data flow into out coming data flow, based on the establish set of steps or procedures. Data Store NotationData stores serves as the warehouse or depository area of data in the system. Sometimes, data stores are called files. Data Flow NotationData flows perform as channels by which packets of information flows. It bridge the gap between a process to another process. Usually, the arrows which represent as data flow channels are labeled with the name of the data that passes through it. External Entity NotationExternal entities are pertaining to the objects located outside the system, through which the system interacts. External entities are, basically, the beginning and ending of the system’s inputs and outputs. Context Data Flow DiagramOf all diagrams, context data flow diagram in most basic data flow diagram since it serves as the level 0 diagram. Context free diagram is incorporated by one process node only, which is the process 0, that take a broad view of the function of the whole system in association with external entities. • The context diagram explains the system limitation or system boundary clearly • It does not typically exhibit data stores because all of the system’s data stores are reflected on within the system capacity • Context diagrams are frequently generate at the same time with the event table. In the context data flow diagram, the analyst will prepare the first level of the data flow diagram which will illustrate the whole flow of information in a system in a single process. Basically, the context data flow diagram will show how the analyst view the whole information system, including the user/s and the interacting actors. For instance, in our previous assignment, the student and the cashier for the payment process. Most of the time, the context data flow diagram does not have any data stores. The context data flow diagram only shows the major data inflows and outflows. Physical Data Flow DiagramA physical data flow diagram shows the clearer division of events and process as well as the different actors interacting in the system and the required data needed as an input to have the desired output. Also, the physical data flow diagram differentiate the manual and automated procedures as illustrated in its diagram. In the physical data flow diagram, the analyst must be able to define the different processes in detailed, must identify the possible and temporary data stores, as well as to be able to know when and where to add controls in order to have more effective yet simple system. Usually, physical data flow diagrams are established and utilized at some point in the final stages of analysis or early phases of design. Physical data flow diagrams are very helpful in terms of defining the alternate execution of a system antecedent to a more comprehensive deign models development. Analysts should always be aware on the possible effect if he will do the creation of physical data flow diagram during the analysis phase activities. Analysts must avoid that one except if he is in the midst of producing alternatives. Analysts should not forget to label physical data flow diagrams to be able for the readers to know that the model shows one probable execution of logical system requirements. Logical Data Flow DiagramAnother type of data flow diagram is the logical data flow diagram. A logical data flow diagram present the flow of the data in the system, how the system operates and how the actor involved in the system process interact with one another. The logical data flow diagram defines the different procedures incorporated in the information system, the data that is required (as to be the input) as well as the possible output after undergoing an event or process. Also, the logical data flow diagram does not necessary go into details in the physical implementation of events when illustrating the activities involved in logical data flow diagram. In the logical data flow diagram, the analyst must ensure that it will help the employees in the organization communicate easily. Also, the analyst must illustrate a high quality logical data flow diagram which will attend to produce a more established and secured system.The analyst needs to be flexible and needs to have a thorough understanding in the logical process of the system to be able to maintain the system and to help the user to easily abolish the redundancies that could be found in the system. As a systems analyst, I must make certain that the data flow diagram I am working at is readable, has a consistency in internal entities, ensure that the system requirements are presented precisely and make sure that it has diminished complexity. To ensure the high quality set of data flow diagrams, analyst can apply the a few simple rules in making data flow diagrams. These rules can be applied by the analyst either in these ways: while developing the data flow diagram, or during a separate quality check after preparing data flow diagram drafts. We all know that, as human, we have limited capability of analyzing and understanding complicated information. Information overload is a term used when a great extent of information is presented all at once. As a good systems analyst, one must divide that great amount of information into subsets to avoid information overload. Dividing this large set of information with the use of data flow diagram would help, not just the analyst, but also those people who are interested to acquire those information, to understand and analyze the information clearly. As a system analyst, he or she is capable in detecting inaccuracies and exemption in a set of data flow diagram by means of looking for discrepancies. There are three usual and easily identifiable consistency errors in making data flow diagrams, according to Satzinger, Jackson, and Burd. • Differences in data flow content between the process and its process decomposition • Data outflows without corresponding data inflows • Data inflows without corresponding data outflows. Resources: http://www.smartdraw.com/resources/tutorials/data-flow-diagrams/#/resources/tutorials/Introduction-to-DFD http://me.emu.edu.tr/ie447/CIMLectureNotes2011.pdf http://www.differencebetween.com/difference-between-physical-dfd-and-vs-logical-dfd/ http://books.google.com.ph/books?id=onoxYRropMoC&pg=PA234&lpg=PA234&dq=what+characteristics+does+an+analyst+examine+when+evaluating+DFD+quality&source=bl&ots=Xiov4kUceS&sig=ePlTUEmtMIw1PEW-EoHYY-Of5Xc&hl=en&sa=X&ei=2mo0T-K0POHemAWa8KGLAg&ved=0CBwQ6AEwAA#v=onepage&q=what%20characteristics%20does%20an%20analyst%20examine%20when%20evaluating%20DFD%20quality&f=false
Last edited by Ailene_Madato on Fri Feb 10, 2012 4:43 pm; edited 2 times in total | |
| | | | annjuviepapas
Posts : 15
Points : 15
Join date : 2011-11-23
| | Subject: Re: Assignment 10 (Due: February 10, 2012, before 01:00pm) Thu Feb 09, 2012 4:41 pm | |
| In the previous assignments 8 and 9, we are assigned to develop a Data Flow Diagram for the Pre-Enrollment of University of Southeastern Philippines. Every level as you zoom in the system, the data flow diagram gets bigger and complicated. Sufficient representation is very important like using proper figures without looking too much details or without explaining the process in every transaction happening in a system. Before you develop a Data Flow Diagram you need first to know the things you are going to handle like knowing what are the types of Data Flow Diagram, the common component parts or symbols, the relationships between the entities corresponding to the process they takes place. With those things, the system analyst must have a fundamental understanding on what he or she evaluating with. What is Data Flow Diagram? Data Flow Diagram is a graphical representation of the flow of your entire system. In addition, it is a graphical system model that depicts process-oriented requirements for an Information System according to the book System Analysis and Design, Fourth Edition by Dennis, Wixom, and Roth. The goal of developing Data Flow Diagram is to let the readers understand easily. I think all we develop a graphical representation to easily understand what the graph is saying to us without reading lengthy explanations. What are the typical symbols used in Data Flow Diagram? Data Flow Diagram usually categorized into 4 parts: the External entities (source/destination of data) are represented by squares; Processes (input-processing-output) are represented by rectangles with rounded corners; Data Flows (physical or electronic data) are represented by arrows; and finally, Data Stores (physical or electronic like XML files) are represented by open-ended rectangles. (http://www.edrawsoft.com/Data-Flow-Diagram-Symbols.php)  (http://www.edrawsoft.com/Data-Flow-Diagram-Symbols.php) What are the components of Data Flow Diagram? The Process The first component is the process, it is also known as bubble, transformation or a function. This component shows a part of a system that transforms inputs into outputs which shows how one or more inputs are changed into outputs. The process is represented graphically as a circle . Some systems analysts prefer to use an oval or a rectangle with rounded edges; still others prefer to use a rectangle.The differences between these three shapes are purely cosmetic, though it is obviously important to use the same shape consistently to represent all the functions in the system. Throughout the rest of this book, we will use the circle or bubble. The Flow A flow is represented graphically by an arrow into or out of a process; The flow is used to describe the movement of chunks, or packets of information from one part of the system to another part. Thus, the flows represent data in motion, whereas the stores data at rest. The Store The store is used to model a collection of data packets at rest. The notation for a store is two parallel. Typically, the name chosen to identify the store is the plural of the name of the packets that are carried by flows into and out of the store. The Terminator The next component of the DFD is a terminator; it is graphically represented as a rectangle. Terminators represent external entities with which the system communicates. Typically, a terminator is a person or a group of people, for example, an outside organization or government agency, or a group or department that is within the same company or organization, but outside the control of the system being modeled. In some cases, a terminator may be another system, for example, some other computer system with which your system will communicate. (http://yourdon.com/strucanalysis/wiki/index.php?title=Chapter_9) Guidelines for Data Flow Diagram The guidelines include the following: 1. Choose meaningful names for processes, flows, stores, and terminators. 2. Number the processes. 3. Redraw the DFD as many times as necessary for esthetics. 4. Avoid overly complex DFDs. 5. Make sure the DFD is internally consistent and consistent with any associated DFDs. What are the Data Flow Rules? As the system analyst, you cannot evaluate the data flow diagram if you don’t what are the fundamental rules of data flow. There are several common modeling rules that I follow when creating DFDs: • All processes must have at least one data flow in and one data flow out. • All processes should modify the incoming data, producing new forms of outgoing data. • Each data store must be involved with at least one data flow. • Each external entity must be involved with at least one data flow. • A data flow must be attached to at least one process. (http://www.agilemodeling.com/artifacts/dataFlowDiagram.htm) What are the types of Data Flow Diagram? There are different types of Data Flow Diagrams, some DFD’s include context diagrams, event-partitioned system models, subsystem DFDs, diagram 0, DFD fragments, process decompositions, physical DFDs, and logical DFDs. • A context diagram contains a single process representing the entire system. The diagram shows important interactions between the system and external agents. • An event-partitioned system model contains one process per event. The model shows important interfaces with external agents. If no subsystem DFD is created, the event-partitioned system model is also called diagram 0. • A subsystem DFD contains one process per major subsystem. The DFD shows important interfaces with external agents. Each process is further represented by another DFD—an event-partitioned DFD (or diagram zero) for that subsystem. • A DFD fragment is a portion of an event-partitioned system model that shows the process, external agents, data stores, and data flows needed to respond to a single event. • Process decomposition is a DFD that shows the internal implementation details of a single process on another DFD. • A physical DFD is any DFD that shows the specifics of a particular system implementation. • A logical DFD is any DFD that shows system requirements under the assumption of perfect technology. -System Analysis and Design, Fourth Edition: Chapter 6, Traditional Approach for Requirements What DFD characteristics does an analyst examine when evaluating DFD quality? In evaluating the Data Flow Diagram, initially the system analyst will check if it is readable. As the system analyst follows the process from the start until he reaches the final spot, he might find some logical inconsistencies, such as black holes and miracles. What is a black hole? - A black hole is a process in which the data enters but never leaves. It is discovered by comparing the content of data outflows to data inflows. What is miracle? - It is a data outflow that appears from a process or a data storage without its corresponding data inflow. Same with black holes, the miracle can be discovered by comparing the data content of data outflows to that of data inflows. In addition, . If a data outflow does not have a corresponding data inflow or can’t be generated from a data inflow, it is considered a miracle. -System Analysis and Design, Fourth Edition: Chapter 6, Traditional Approach for Requirements The System analyst can evaluate the readability of the data flow diagram by measuring the overall complexity of each model component and evaluating it with the rule of seven plus or minus two. Reference (http://www.edrawsoft.com/Data-Flow-Diagram-Symbols.php) (http://www.agilemodeling.com/artifacts/dataFlowDiagram.htm)
Last edited by annjuviepapas on Thu Feb 16, 2012 10:45 pm; edited 1 time in total | |
| | | | patrickduanevalle
Posts : 15
Points : 15
Join date : 2011-11-24
| | Subject: Re: Assignment 10 (Due: February 10, 2012, before 01:00pm) Fri Feb 10, 2012 2:39 am | |
| Name: Valle , Patrick Duane Course/Yr: BSCS III Assignment 10
With reference to assignments 8 and 9, what characteristics does an analyst (you) examine when evaluating DFD quality? Data flow diagram is a graphical way of representing a data flow in a system. It is an effective way of overviewing a system in a very clear manner. In planning a system, DFD must be presented because by viewing the diagram, you can determine what is missing and what is to be removed in the system flow. In making a DFD, we make sure that the details are correct and every process has been evaluated to insure the quality and integrity of the DFD. In making DFD, we must also follow some guideline to follow and some characteristic that needs to be developed.
When I evaluate the data flow diagram quality, I evaluated first if the structure is match to the real system. When evaluating the DFD, by just viewing it as a general structure, you can see what it means because DFD is a diagram that explains the context of the system in a simple manner. I can say that it is very understandable when we look at it because DFD especially those context diagrams which is a part one of the DFD is being created for those people who are not so technical in nature. You need be analyzer and a good cretic so that you will know if the DFD is being built for a specific system and not for the foreign structures. In criticizing a DFD, we must be reminded that we need to see the actual structure before criticizing the DFD structure. That must be in the first of your list in evaluating and criticizing DFD.
In the DFD part, when examining it, you must first know the structure and every details of the diagram. You need to know first the function and limitation of the structure inside the diagram. To know the diagram first is the first step in examining the diagram. The structure is a very important aspect to be examined in the DFD. In the structure, you will know the basic functions inside the diagram and the limitation will be uncovered. You must examine the broadness of the structure and you must determine the range of it. Broadness is talking about how general the structure is and the range is the distance between the general aspects of the diagram to the more specific structure. As I understand the question, I formulated an answer with two points. The first point is the physical characteristic of the DFD and the second is the logical structure of DFD.
The first point is for the physical characteristic which is talking to the physical attribute of the diagram. When examining diagram, you must understand every symbols inside the diagram. Like the starting state, end state, all those process and other function inside the diagram which has a physical attribute. Physical attribute is what you see in the diagram and what everybody sees even thou they are non-technical people. Physical attribute is the first to be evaluated if I will be the analyst because physical attribute is the syntax of the structure. I can say that it is the syntax because if the symbol is not in the proper position then the diagram fails to serve its purpose because it does not follow what is proper. Like arithmetic function, if your syntax is incorrect then it will give you the wrong answer. In physical attribute syntax will be the first security for the correctness of the diagram. It must be evaluated to proceed in the next process.
The second point is the logical characteristic of the diagram. When we talk about the logical characteristic, we are pertaining to the logical structure which talks about how we understand the process in the diagram provided. If we are finish evaluating the physical structure, the next security feature is to evaluate the flow of the system, data and every object inside the diagram. The example of a wrong logical structure is when you have a data let say a student data then it will an input data to the admin division which is incorrect in nature. Student is not related to the admin because admin and student data is different. We can say that the correct interpretation of a logical structure is that the subject will be an input of the student which is enrolled to a different course. I must say that evaluating the characteristic of a logical structure of DFD is the difficult par. Logical Characteristic is not visible to the human eye but it will just be visible if you will analyze and understand the physical structure. In this level, the non-technical people will not be effective in this field. In the characteristic, it is more on understanding and not calculating. The said characteristic will be the life of the diagram and the physical structure will be the backbone. The logical will always be the brain of the diagram and we need criticize it carefully because the common problem of an analyst comes from this section.
The physical and logical characteristic must work together. This two are the one who made the diagram possible. In the human form, the logical characteristic will be the brain and veins or maybe the soul and the physical characteristic will be the bones and muscle. The physical characteristic will hold the structure and prevent it from collapsing and the logical characteristic will be the controller. The two are important and if something wrong with either of the two, the diagram will not work properly. For me, physical characteristic is almost visible for everyone because in this area, you have clear guidelines and you need a less effort and less thinking skill for this one. In the logical characteristic is a different story because you need to have more intellectual property which is the analization, critical thinking, good observation, and other property that require a large portion of the mind.
The composition of a physical structure is those who are physically very visible in human eyes like the actor, the process, the system. It is noticeable and if there is something wrong, you can figure it out easily. In the logical composition can’t be seen because they just exist inside the physical structure. They seem to be visible because the physical structure allow them to appear like they are present outside the diagram but in the reality, they just exist inside the diagram. In logical structure, you can correct them using the physical structure. You can manipulate them using the physical structure. It is somehow confusing but logical structure is just an imaginary variable for me. For me, it is an object with an object that’s why they are hard to detect because they leave inside the structure.
In examining diagram, you must not always look in the diagram itself because another way to examine a diagram is to examine your characteristic. You also need to examine the one who evaluated and make the diagram to evaluate the diagram itself and the thing that you need to examine is the characteristic of the evaluator which is you, I and them. Your characteristic must not always be in focus about how beautiful and organize a DFD is but you must be focus on how it is related to the system. As a starter analyst, I need to set my mind on the goals of the DFD. This means that I need to focus on what will be the function of the DFD and not how beautiful it is or how organized it will be. I must stick on how it is related and how it describes the object which is the system. Focus is also a good characteristic of an analyst when evaluating DFD because if you are focus enough, you can’t be destructed of how the other sees the diagram. You will not be affected of the comments of your co analyst but you can always use their words. If you are also focus, your decision will be more concrete and accurate hence accuracy is a very important thing that the analyst must have. For me, to be focus is an occurring event and my focus is dependent in every situation. Sometimes, I lose my focus when I am not interested of what I am doing. I also lose my focus if something is destructing my way of thinking like problem that I encountered during class hours or having trouble outside with my friends. I need to get rid of it when someone or something is destructing my way of thinking.
Another characteristic of an analyst must have when he/she will evaluate diagram is interest. In evaluation, analyst is not effective if they lose interest. If they don’t like the things that they are doing, the percentage of making the evaluation right will be going down. Interest is a powerful characteristic because if you will have lots and lots of interest in your field and the things that you do, you will make it sure that you will do it right. You will never allow yourself to lose focus and you will be happy of what you do. Interest push the analyst to their limitation and surpassing limitation is a key for progression. You will be more effective if you will always do the things above your limitation and is a sign of a good system analyst. Interest will not assure you of making your work done with one hundred percent accurate but it will help you to make your work done with all your best. Interests will always guild the analyst in a right track in evaluating DFD. Doing things without interest is not a characteristic of a good analyst in evaluating the diagram but it will just make the analyst to be like a robot because robots have no emotion and they are always be in their level as the programmer programed them. I do believe that interest must be included in the characteristic of a good analyst because if not, that analyst will not accomplish something or not satisfying the needs of the client. If you will be interested in evaluating the DFD, you will be more observant of every detail in the diagram. You will not be hasty to give your evaluation because as I said, you are interested and interested people will show interest to their work and give an extra effort in evaluating the diagram.
To be an observant in every details of the diagram is another characteristic of an analyst. This is important in evaluating the diagram because if you will be observant in every details of the diagram, you will discover if something is not right about the DFD structure. An observant characteristic will unlock those unseen error and it will provide the analyst a vision of correctness. Accuracy will not be a hindrance if an observant characteristic will flow inside the attitude of an analyst. A keen mind widens the perception of an analyst in examining the diagram and the wider the vision is, the more effective the diagram will be. Another advantage of a good observant is you will never see the diagram as a general concept or general system hence, you will see a variety of different structure and different interpretation. Seeing a different structure in a diagram will make your evaluation to be more flexible because you will not just evaluate it as a single structure but you will also consider those variety of interpretation that my come up during the evaluation time. If the analyst will observe that the diagram is in general form, by the power of the observant mind, he/she can turn the table and make it to be more specific and accurate in describing the system with the use of the proper diagram.
Correctness is a characteristic of a person which assures all things in accurate manner. Seeing and evaluating diagrams doesn’t mean that you will just observe the diagram itself. Before and after the diagram is being implemented, you must check the physical structure of it. To see is to believe and when evaluating a diagram, if the physical structure of the diagram is presented, you need to look at it and evaluate if the diagram provided is the diagram for the structure. In evaluating diagram, you must be correct always in your evaluation because your opinion is a crucial part of making a system. Correctness is a prevention of a further damage that may occur during the development of the system.
| |
| | | | viktor immanuel calonia
Posts : 15
Points : 15
Join date : 2011-11-23
| | Subject: Assignment 10 (Due: February 10, 2012, before 01:00pm) Fri Feb 10, 2012 4:58 am | |
| Basically, when you are evaluating a specific system, you have to review the things and events that are involved in the processes. Requirements must be modeled out so to have a better representation and understanding. Other from mathematical models which represent series of formulas and descriptive models which are narrative in forms, most models used in system analysis and design are graphical models being characterized by diagrams and schematic representations of some aspects of the system. Mainly, these models describe the details of what the system does when an event occurs. They are created to activities of information systems and interactions between computer processes and data.
An analyst must learn how to define every process on a Data flow diagram. The system analyst must know how to keep braking down Data flow diagram to more detailed one. The system analyst also must understand the algorithm to be able to describe the process. He/ she must know how to decide , must identify the decision variable and the system analyst must need to consider the number of locations of users, the processing and data access requirement, volume and timing of processing and access. The system analyst also must be able to translate the process into a diagram. He/ she must describe complex interactions and also alternative approaches.
The most important thing a data flow diagram does is to keep the program organized. Programmers use data flow diagrams to plan exactly how their new program is going to accomplish its intended purpose. While more simple programs could probably be made without using a data flow diagram for organization, creating more complex ones, especially with groups of programmers, definitely requires the use of a data flow diagram to help keep the program on track.
Oriented Analysis is as follows: Requirements determination, Object oriented modeling, Data modeling, and Alternative solution generation. The main sources from which the analyst can gather requirements are books, journals, people, current system documentation, websites, and articles. Break the business rules. For example, there is a rule that an organization can only use standalone system for all of its branches because of security reasons and an analyst can convince them to use online system having Internet securities.
The general thing that the system analyst must consider in examining the quality of the Dataflow diagram is if it really representing the system that was analyzed. The system analyst must make it sure that the dataflow diagram that he made, would resemble the real system, the system that he wants to represent in dataflow diagram. The system analyst must know everything, inch by inch, about the processes, activity and dataflow of the processes of the system that the system analyst works with.
The characteristic that the system analysts examine to ensure the quality of the Dataflow diagram is the elements that composed of it. The system analyst must ensure that the elements used in making the Dataflow Diagram are the right elements to represent the dataflow of the system. There should be a representation of every elements of the system. To know these elements, it will be discussed later on this writings.
According to Conrad Weisert, Information Disciplines Inc., Chicago, The elements of a Data flow datagram
A Data flow datagram contains four kinds of symbol:
• Processes -- The only active elements. Processes cause something to happen. They have embedded descriptions, often in verb-object form.
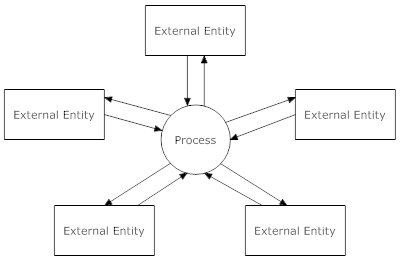
• Terminators -- Represent users or other systems, i.e. entities outside the boundary of the system being described.
• Data flows -- Composite data items (or objects) that pass either
• Data stores -- Holding places for data flows; often implemented by databases.
In this case, comparing it with my work in the assignment 9, these elements of the dataflow diagram are present and were used as a representation of certain element in the system. These Data flow diagram was based on what was based on the representation of the activity diagram on assignment 8.
Systems analysts apply this checklist to look for errors in their Data flow datagrams:
• Every process must have at least one input dataflow (Violators are called "magic" processes, since they claim to do something based on no input, not even a trigger.)
• Every process must have at least one output dataflow (Violators are called "black hole" processes, since their inputs are swallowed up for no reason.)
• Every dataflow must connect two elements. One of them must be a process; the other can be a terminator, a data store or another process.
• Each dataflow diagram should contain no more than six or seven processes and no more than six or seven data stores, and all the processes should be conceptually at the same level of detail. If a part of the system is too big or too complicated to describe in an easily grasped diagram, break it down into two or three lower-level diagrams. (We sometimes see hanging on an office wall a huge tour de force DFD that tries to describe an entire large system at a low level of detail with several dozen processes and convoluted intersecting dataflow arrows. That's not something to be proud of. It doesn't communicate to any audience.)
• For every process, one of the following must eventually be true:
o The description label is so simple and unambiguous that every reader will understand it in exactly the same way.
o It is expanded or decomposed into a separate lower-level dataflow diagram that preserves exactly the same net inputs and outputs, but shows internal detail, such as data stores and internal processes.
o It is rigorously described by a separate process specification (business rule, decision rule, function definition, algorithm, etc.).
The starting point: Context (level-0) diagram
The systems analyst begins by preparing the top-level DFD. This "context diagram" shows the entire system as a single process. Interactions with users and other external entities are shown as data flows.
The context diagram, although often almost trivially simple, serves two essential purposes:
• It clarifies to the user audience the analyst's understanding of the scope of the proposed system, the kinds of users the system will have, and the data coming out from and going into the system. A surprising number of misunderstandings are exposed at this early stage.
• It motivates and establishes a framework for the more complicated next level (below).
The context level dataflow diagram of the assignment 9 shows the context view of the system of the USEP Pre-enrollment system.
The system diagram (level-1 DFD)
After being agreed that the context diagram is justifiable and acceptable, the systems analyst examines the first-level breakdown of major functions. Most systems can be decomposed into between two and seven major areas.
From that context view, in the assignment 9, the representation of logical and physical data flow was also represented. It shows the detailed dataflow in the processes in the Pre-Enrollment of the University of Southeastern Philippines.
The dataflow diagrams are complete when:
• Every process on every DFD complies with rule number 5 above.
• Every dataflow shown on every DFD is defined in the data dictionary.
There's more to come, but the remaining components of the system specification (or detailed user requirements documentation) have little or no effect on the functionality of the proposed system. it is also noted that the information contained in the Dataflow Diagram is essential not only as a foundation for building a custom application but also as a basis for evaluating and choosing a packaged application software product.
Analyst is the most responsible person for the new system project management and therefore he should possess and behaves the following characteristics. The analyst should: Question about every aspect of current and new system. Assume that everything is possible and do not accept such sort of statements, "This is a routine operation to perform such type of job in our organization". Pay intension to each and every single answer because each answer could generate many important questions related to problems of current system. Restructure his mind before the development of each new system and do not correlate with previously developed systems. Have excellent communication skills. Identify and translate the problem of current system. Generate the maximum solution of the problem. Explain the logic of his solutions. Learn from mistakes. Not be bias to the customer or the software house for which he/she is working. In developing a physical data flow diagram, an analyst must explore the process for more details. Maintain consistency between the processes. Follow meaningful leveling convention. Ensure that data flow diagram clarifies what is happening in the system. Always remember data flow diagram audience. Evaluate data flow diagram for correctness. The system analyst must be able to communicate in writing and orally. The analyst must easily get along with people. The analyst must be a good listener and be able to react to what people say. The analyst must be knowledgeable of technology. The analyst is not expected to know the intricacies of programming, but a decent general knowledge of concepts and terms is essential. The analyst must be knowledgeable of business. The analyst is not expected to be an expert in business but a decent understanding of the client's world is required.
| |
| | | | Michael S. Palacio
Posts : 15
Points : 15
Join date : 2011-11-23
Location : Davao City
| | Subject: Evaluating High-Quality DFD Fri Feb 10, 2012 7:05 am | |
| In systems analysis and design, there are a lot of tools used to understand fully the structure and the different processes of the system being studied. One of the tools used to recognize the structure of the system is by the use of visual diagrams. Visual diagrams help people to know the general overview of the system, which eventually would lead to the understanding of the whole system when presented with more types of the visual diagrams. There are many types of diagrams to model the systems. They may be diagrams that show the structure of the system or diagrams that depicts what happens in the system. There are also diagrams that depict the flow of data. One of them is the data flow diagram or DFD.
Data Flow Diagram
Data Flow Diagram or DFD is a structural diagram that illustrates the flow of data from external entities into the system, shows how the data moved from one process to another, as well as its logical storage (Ambler, 2009). Data Flow Diagram shows how the data is processed by a system in terms of inputs and outputs (SmartDraw). In short, DFD’s illustrates how the data flows and how it is handled by the system.
Data Flow Diagram Symbols
In Gane and Sarson notation of a Data Flow Diagram (Ambler, 2009), there are four symbols used to illustrate the flow of data.
• Squares for External Entities
Squares represent the external entities of the system. These external entities may be the source or the destination of the data. For example, in an enrolment system of a university, a student gives his or her basic information to the University for Them to have a record on him. Therefore, the student is a source of information and thus is drawn inside a square or a box.
External entities are named appropriately. Squares of the same name can be duplicated one or more times to avoid line crossing on the diagram. With this, the diagram would be much cleaner or organized well. In identifying an external entity, one must determine first the system boundary. The system boundary is the limitation of what the system is able to process. The external entities should be outside of the system being studied. External entities are usually beyond the area of influence of the system developer. Meaning, there are instances that some external entities could be omitted unintentionally. Thus, identifying external entities should be done carefully.
• Rounded Corner Rectangles for Processes
The rounded rectangles represent the processes of the system. Inside the rounded rectangle, there is a two-partitioned space or sometimes there are three. The top partition shows a number that depicts its process number or its order on the system. In the middle is the name of the process that is to be used. And on the bottom partition, it is written there the actor or the person involved on that particular process. It is him or her that receives the data and processes it. The processes we are talking about are the processes that take data as an input and do something to it; example is outputting it or storing it to a database.
Processes show that there is a change or transformation of data happening. So when there is a transformation, then it is obvious that there is an input data and an output data. Naming of the process should also be done rightfully. In naming the process, it should consist of a verb and an object of the verb. There is no subject on the name of the process and the word “process” should not be present on the process name. Each process should also represent only one function or action. So if there is an “and” on the name, then there are already two or more processes or functions. That process should be separated then.
On a system, there could be leveling of processes. With leveled processes, there are some processes that are sub-processes of a process. So to identify them easily and clearly, numbering the process is allowed. For the sub-process, one could identify them by using a decimal notation. For example, a main process has 3 sub-processes. So the main process, assuming it is the first process, would be 1 and the sub-processes would be 3.1, 3.2, and 3.3.
The arrangement of processes in a data flow diagram is generally from top to bottom and left to right. This is done to have a uniformity of the diagrams. It would also help to read and understand efficiently the flow of the data.
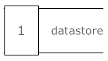
• Open-ended Rectangles for Data Stores
These open-ended rectangles are the data stores or storages. When we mean data stores, it could be physical or logical. Logical data stores are the databases or the XML files of the system while the physical data stores are the filing cabinets or the stacks of papers. Data stores are important because it has the summary of all the information gathered and to be used by the system.
• Arrows for Data Flows
Arrows represent the direction of the data flow. It shows where the data comes from and where the data goes into. It connects the three other shapes mentioned earlier. The data that we refer in the system may be the electronic data or the physical items such as the documents and papers.
When there are two or more processes that output data that flows to the same destination, then the arrows could be joined. This also means that when same data goes to two or more separate destinations, then the arrow could be forked or divided into multiple arrows going to multiple paths.
One thing to mind about the arrow or the data flow is that it should represent data only and not the control. To show the control of data, one can do that by using another type of diagrams. For in data flow diagram, it only shows how the data flows in the system.
In naming the arrows or data flow, it should be done by labeling it with the specific data that is passed either as an input or as an output. The name should not contain the word “data” for it is obvious already that the arrow represents a data. 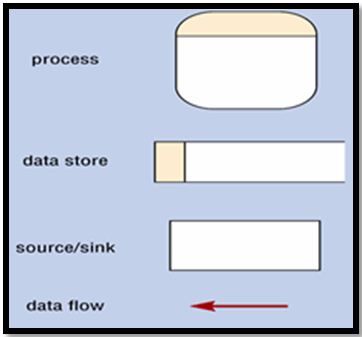 [/url] Figure 1. Symbols on a Data Flow Diagram or DFD Constructing Data Flow Diagram (DFD)
To construct a quality data flow diagram, a procedure should be followed so that we could be ascertained that the diagram we are making is correct and understandable even by a person that does not know a data flow diagram.
1. Identify and list external entities.
The first thing to do, and one of the most crucial parts in constructing a data flow diagram, is to identify all of the external entities. As what have mentioned previously about external entities, these are the objects that are beyond the system boundary. They are usually the source of data that goes into the system.
2. Identify and list input and output data.
The next step is to list down all the input data from the external entities to the system and all the output data from the system to the external entities.
3. Create the context diagram.
After identifying the external entities and the different input and output data, a context diagram could now be drawn. A context diagram is a diagram that shows the flow of data between the system and the external entities. The system is on the center and surrounding it are the external entities. The system is represented as one process that receives data from the external entities and outputs data to the external entities.
4. Identify business functions.
Now that we have the context diagram, we could now delve deeper on the specifics functions and actions on the system. So we have to list down all the processes of the system.
5. Identify data connections between business functions.
As we are in knowledge that processes are done sequentially, we now have to identify the correct sequence of the processes. We also have to determine the data that flows between them.
6. Confirm data distribution and reception.
Next is to confirm that the data from the external entities goes into the system and is received by the correct process that needs the data.
7. Trace and record the data flows of the system.
Tracing and recording the data is done to ensure that the data flow is correct and there is no data that strayed to different process.
8. Connect diagram segments.
If there would be segmented diagrams, then we should find the connection between those diagrams. If possible, there should be no segmented processes on the system. All processes should be connected to each other.
9. Verify data flow source and destination.
We should now verify that in every process, the data that goes in must go out, even if there is no transformation of data that happened. In this step, we should check if there is an existing diagramming mistake such as a black hole, grey hole, or a miracle.
Black holes are processes that have input flows but do not produce output flows. Grey holes, on the other hand, are processes that produce output that could not possibly be produced given a certain input. And lastly, a miracle pertains to process that does not have any input but was able to produce an output flow.
10. Simplify and redraw the diagram.
After checking that there are no errors on the diagram, we could now simplify the diagram and redraw it to finalize.
11. Repeat step 1 if needed.
If still not sure on the finished diagram, we could go back to step 1 and verify for any changes that occurred in the new diagram that did not appear on the previous diagram.
Characteristics of a High Quality DFD
A high quality Data Flow Diagram should be:
• Accurate
A DFD’s accuracy is measured in terms of the number of the diagramming mistakes present such as the black holes, grey holes, and miracles. A high-quality DFD should not have any of these mistakes. To avoid the mistakes, one should follow carefully the guidelines on how to construct a data flow diagram.
• Readable
A Data Flow Diagram is readable when it is not too complex. Too much complexity could result to hard time in tracing the flow of data. Following the rule of arranging the processes from top to bottom and left to right would really help to decrease the complexity of the diagram. Numbering of the processes would also increase the readability of the DFD. Proper naming of the components of the system should also be done rightly.
http://www.agilemodeling.com/artifacts/dataFlowDiagram.htm http://www.smartdraw.com/resources/tutorials/data-flow-diagrams/ http://spot.colorado.edu/~kozar/DFDtechnique.html http://faculty.babson.edu/dewire/Readings/dfdmistk.htm http://www.docstoc.com/docs/69651149/Chapter-6 | |
| | | | Gertrude_R_Cordero
Posts : 15
Points : 15
Join date : 2011-11-23
| | Subject: Assigment # 10 Fri Feb 10, 2012 9:14 am | |
| With reference to assignments 8 and 9, what characteristics does an analyst(you) examine when evaluating DFD quality?
Before enumerating those characteristics of Data Flow Diagrams that the system analyst should examine, let’s discuss first what a diagram is and why it is used when designing systems.
So, Diagrams are tools that aid the system developer on designing and developing systems. Diagrams, in general, are created to better understand the processes that the system performs and what are the sub-sets or sub-systems that are included on that system. A system is too broad if it is to be examined in general, so diagrams are created in order for the developer to have views on the processes and actions the system undertakes. Naturally, we cannot see the processes that the system undergoes with our eyes. Diagrams create different views of the system processes for the developers and with this, developers will be able to evaluate and redesign (if it is needed) those processes that may not be efficient or suspicious. When it comes in designing systems, it could be a great help for the developers if system process is defined in terms of diagrams. With this, developers can track data inputs and outputs from one process to another.
As to what I mentioned awhile ago, a system can be too broad if we are going to look it into the outside. Some processes may be visible but not as detailed or not as specific as on how it process those data that are has been inputted or how it generates output. Diagrams can represent processes with different levels or depth depending on the needs of the designer. If it is just the general processes of the system is represented in the diagram or it could be the sub-processes of that process in the system.
What is Data Flow Diagram? It is a modeling significant modeling technique for analyzing and constructing information processes. Data Flow Diagram shows how the movement of information throughout the processes based on inputs and outputs given by each processes in the system. Data Flow Diagram illustrates technical or business processes with the help of the external data stored, the data flowing from a process to another, and the results. First, the system designer draws a context-level Data Flow Diagram which shows the relationship of the internal and external entities as single step, input and outputs [1]. Data Flow Diagram provides isolation of data which is called data stores that are derived from a process steps being executed within the system processes [2]. Some key characteristics of Data Flow Diagram that are mentioned by Charles(1999) are:
Two-dimensional Summary – Data Flow Diagram summarizes data flow characteristics of of a process on a single page and can provide a useful and concise summary of system-related process attributes. An example of this system-related process that mentioned by Charles(1999) is data-driven processes. This processes are dependent on the data that is being processed. This processes also takes its actions based on what kind of data is passed on it.
Completeness – When creating the Data Flow Diagram of a system, it is easily to look after those components that are needed for the system since it represents your idea of the data that is being inputted and produce by each processes in the system.
Processing, not processes – This term or word may be confusing when it comes in designing Data Flow Diagrams, process. We refer process as the movement of data throughout the system but in Data Flow Diagram, process is the “steps” or operations made in requiring and outsourcing data on the process, processing work.
Patterns – Data Flow Diagram helps the system designer to track which processes requires, stores and generates data or those processes that do not need any. With this, system designer can pin-point critical sections of the system and provide supports or revisions to it.
Another thing that we should know about Data Flow Diagram is those symbols that are used in making one. This symbols represents each entities or processes which is required in the designed system. These symbols and their descriptions are as follows:
Source – it is any data that is identified outside the boundary of the process that Data Flow Diagram is modeling [2]. For example, in UseP's pre-enrollement process, the data source are those requirements like personal information, form 138, certificate of moral conduct and 2x2 pictures that is needed at the UGTO in order to proceed to the process of the pre-enrollment process.
Processing Step – it is the activity that process data. It is presumed that the processing is important enough to play a significant role in the system's process that Data Flow Diagram is modeling [2]. Processing step may or may not be sound as if there is data processing involved but it is still relevant enough to the design system. For example, in UseP's pre-enrollment process, “Get Examination Schedule” process in a Data Flow Diagram in Assignment # 9 describes the processing actions that should be done in order to process the request.
Data Store – it is not the same way as Database. It is a collection of accumulated data that is used by the process. This accumulated data may not in in form of an electronically created file but it could be as papers records. One thing that is why we design Data Flow Diagram is for us to identify entities that is in the data store which serves as the basis of designing Database using Entity Relationship Diagram [2].
Data Flow(s) – it is represented by arrows and labeled with the data that is passed to another process and the arrowhead indicated where data is passed to [2]. Data that was on the data flow are the results of a process in the system which serves as a requirement for the proceeding process of the system.
And now that we know what is Data Flow Diagram is about, let us find out what characteristics does an analyst examine when evaluating Data Flow Diagram quality. First, we should know what are the requirements of the system and does it have representation on the Data Flow Diagram. It was mentioned above by Charles (1999) as one of the characteristics of a Data Flow Diagram is completeness. It is important that all requirements of the system (atleast) was on the Data Flow Diagram because as what is mentioned above, processes is presumed to be important enough when modeling the Data Flow Diagram of the system. So, any missing process or entity may result into inefficiencies in the Data Flow Diagram. Completeness in the diagram makes it more clear when someone will review the processes or when presenting it to those who are concern. At it was said on a quotation, “It's the first impression and will either open the door or close it”. The first thing that will undergo on the test of quality of Data Flow Diagrams is how the diagram looked like. It should give (in general) to those who will look at the diagram what are the processes that occur on the system and those external entities that is needed on the modeled system. These also refers to the symbols used in creating the Data Flow Diagram, correct symbols should be observed and used when defining processes and other entities of the system being modeled. Second, Data Flow Diagram is modeled based on the system requirements so by virtue, Data Flow Diagram should summarizes the processes and actions that the modeled system has. Ala dapat dagdag-bawas unless if it is beneficial to the system being designed. Third, the Data Flow Diagram should enables the analyst to determine critical parts of the system being modeled (processes that requires large amount of data) and be able to observe activities that occurs on every process the modeled system conducts. Data that are passed on the proceeding processes should be stated and as it is expected from the previous process. Fourth, Data Flow Diagram must also identifies those processes that can be analyze further. By creating levels of the processes on the modeled system, the analyst can have a closer look to the underlying processes in a process of the modeled system. And lastly which does not actually refer to the diagram but to those who analyze the Data Flow Diagram. Analyst should keep in mind the goals why the the analysis is conducted, it is to modeled and design that will meet the requirements set by the benefactors and make the modeled system effective and efficient. Analyst should be observant, every details that are presented on the diagram should have taken into account by the analyst and treat it as relevant date for the analysis. Analyst should also have the knowledge and insights on the processes that a system is required to do and all other ideas that makes its processes more efficient and be able to express those ideas by means of plotting it on the Data Flow Diagram.
References:
1. Data Flow Diagram
http://www.edrawsoft.com/Data-Flow-Diagrams.php
2. Data flows: Note on Data-Driven Process Modeling - Data Flow Diagramming by Charles Osborn 1999
http://faculty.babson.edu/dewire/Readings/dfddiag.htm | |
| | | | melissa_carpio
Posts : 15
Points : 15
Join date : 2011-11-23
Age : 32
Location : 773 Panorama Homes Buhangin, Davao City
| | Subject: Re: Assignment 10 (Due: February 10, 2012, before 01:00pm) Fri Feb 10, 2012 10:12 am | |
| Melissa B. Carpio
BSCS 3
The previous assignments we had in our subject were related to diagrams, particularly the activity diagram and the different types of data flow diagram. In assignment 8 and 9, we were tasked to design activity diagram and data flow diagram for the pre-enrollment system of USEP. Here in assignment 10, we are tasked to discuss the characteristics of how an analyst examine when evaluating Data Flow Diagram quality. Before I discuss what characteristics an analyst examines when evaluating Data Flow Diagram (DFD) quality based on the assignment 8 and 9, let us first understand what a DFD is and how is it important in the preliminary phase in a certain project.
Understanding Data Flow Diagram…
A Data Flow Diagram (DFD) is graphical representation that shows the process, flow of data, and other external entities that works within the system. DFDs transform information from input to output in the system. By the name itself, data flow diagram, it consists of different symbols that have specific usage in order to identify the flow of the data. The most commonly used symbols are the arrows, which represent the data flow; the rectangular box, which represents the external entities, the source or the destination of the data; the rounded squares, which represent the process of data, from input to output. Some points are needed to be considered when dealing with data flow diagrams, where the information being inputted came from and where would the information go after being processed; what would happen to the data as it enters in the system and what would be the possible outcome of it; and where would the output go after the process. There are different levels of dataflow diagram, the Level 0 diagram or the context diagram and the Level 1 data flow diagram. The Level 0 diagram or the context diagram shows the direct flow of data from the source to its destination. It depicts a single process of the system with different source of data. The Level 1 data flow diagram shows the system’s preliminary processes, the data stores, sources, and destinations of data linked by data flows.
Even if data flow diagrams are useful to the analysts when it comes to planning n making a system or handling a project, there are still pros and cons in dealing with DFDs.
Pros...
* DFDs give further understanding on the underlying system and sub-systems.
* It basically gives the over-all summary of the system.
* It serves as one of the blueprints of the project, thus making it an important file.
* It serves as guide to other members of the team since developing a system is not part of the work of an analyst.
* Since DFD is a graphical representation of data flow, it would be easy for the team to trace errors when handling the system.
Cons…
* When a client desires to have a complicated system, the first problem would be making a complicated data flow diagram also to ensure the proper flow of data in the system.
* Some data flow diagrams that are designed may not be followed thoroughly because in actual designing of the system, it could be interpreted as a complex system.
* DFDs that may not be designed clearly can confuse the other team in understanding the flow of the system.
Data Flow Diagrams: Systems Analysts’ helpful tool
The complexity of a certain system can be visualized with the use of the data flow diagrams. It is a very helpful tool for the systems analysts especially in the preliminary phase in planning to create a system. For me, data flow diagrams could be very complicated when in terms of the number of systems included, the external entities related to the system and the flow of each data from the source to the destination. But on the helpful side of data flow diagram, the analysts can visualize the flow of the data in a system. He can anticipate the problems that may arise as the flow of system is analyzed. The system would be at risk if the systems analyst would not deal with the data flow diagram first before going to design the system. Every planned system of the systems analyst must have DFDs to support their planned system.
On Evaluating Data Flow Diagram quality…
Now on the main purpose of this assignment, what characteristics does an analyst examine when evaluating data flow diagram quality? To answer this question, here are some of what I did and anticipate in order for my data flow diagram to be understood (hopefully…) by others.
Data Flow Diagram must be readable. According to our interview with Sir Rex Bugcalao, the work of a systems analyst is to design a system that is fit to what the client wants. The designing includes creating a data flow diagram of the system. Data flow diagrams are essential in designing a system since it is the basis for the flow of the system. In order to attain the principal use of the DFDs, it should be readable enough to understand the data flow of the system even if the one looking at the diagram is not an analyst or a part of the team, it should be understandable enough so that there would be no hassle in the part of other team members and for the future developers of the system.
Minimal Complexity in DFDs. Most complex systems come from complex plan on the data flow diagram since it is the basis in designing the system. Making a data flow diagram would really take time and understanding to include all possibilities that the system may execute and perform. Too much information and possibilities that the team considers would be a burden in their part because it could lead to misunderstanding since a lot of information must be dealt with. In order for this not to happen, the analyst will just deal with the levels of DFDs, deliver the diagram clearly and not to commit misunderstanding at the start of the preliminary phase.
Consistency of the DFDs. The DFD is an essential tool in creating the system needed by the client. Any form of inconsistencies in the DFD can result to a dilemma in developing the system. First problem would occur on the members of the team in developing the system. The plan would start from the systems analyst, which includes the making of the data flow diagram and other diagrams that depicts the system. In order for the members to start what they supposed to do in the system, they first look at the DFDs made by the analyst to know the flow of the system. The members should be critical enough in understanding the flow of the system since they are the ones who will develop the said system. If one of the entities does not correspond to the DFD designed, it could create inconsistency in the planned system and the actual system. Second problem may occur when after the development of the system; the client tends to change some of the details in the expected system. The designed DFD now does not jive from the expected system of the client. This will cost time for the systems analyst since everything is set but there arrived changes in the plan.
Inconsistencies inside the DFD can be identified easily by merely looking at the structure of the diagram. Some of the common consistency errors are pointed by Satzinger and others.
* The different approach on the data flow content between the physical process and the internal process of the system or the process decomposition. For example, an enrollment data flow that appears on a level-1 diagram, but not seen on the level-0 diagram. That would create a consistency violation on the DFD.
* The input data that does not correspond to the output data could lead to inconsistency in delivering the data inside the system.
* The output data that is not expected from the given input data is also considered as inconsistency in the flow of data in the system.
Understanding Black holes, Grey holes, and Miracles. There are several diagramming mistakes that may occur in creating a DFD. These mistakes should be critically examined by the analysts and it should be primarily considered to ensure that the designed DFD is capable of delivering the expected system needed by the client. Black holes and miracles are commonly mistakes that can be evaluated easily. Black hole is a situation where in the processing step has an input flow but there is no matching output flow. For me, it is called black hole since the process of the input flow leads to an unidentified outcome. Miracle is another situation where in the processing step may derive an output flow but no corresponding input flow. Same as the black hole, it is called miracle since there is no specified input flow but there arise an output flow of data, which creates a question, where could this output flow came from without having a corresponding input flow? Lastly is the grey hole, a situation where in the processing step may haw an output but is not adjacent to the input, it may be that the output may be greater than the sum of its inputs.
Source:
http://www.hit.ac.il/staff/leonidm/information-systems/ch24.html
http://it.toolbox.com/blogs/enterprise-solutions/data-flow-diagrams-dfds-14573
http://faculty.babson.edu/dewire/Readings/dfdmistk.htm
| |
| | | | kenneth jan malubay
Posts : 15
Points : 16
Join date : 2011-11-23
| | Subject: Evaluating DFD Fri Feb 10, 2012 11:14 am | |
| In this chapter I will discuss the characteristics of an analyst in evaluating the Data Flow Diagram. But before getting to the main point of this assessment let us know first what a Data Flow Diagram is because not all of us know the true meaning of it.
Data Flow Diagram from the name itself it is the flow of information that is represented diagrammatically. It is sometimes understand by the other as steps of the system. It is a guideline to the others on how to approach the phases in each system or what is next after finishing the last phase. Data Flow Diagram is basically used in the designing phase in building a system. It is a system modeling tool in structured analysis and design.
To understand this tool deeper they are notations in this tool in my reference there are 5 notations in DFD to show the passage of the data through the system by using basic constructs.
• Data Flow – it shows the flow of the data represented by the arrow line with arrow head. It can move from external entity to process, from process to another process and from process to an external entity.
• Processes – these are transformations which change the incoming data flow to outgoing data flow. The name of the process must describe what may happen to the data when it passes through process. It is represented by circular boxes.
• Data/Stores – this is depository of the data or we can say the database. The data/store is represented by parallel lines and between those lines is the name of the data.
• External Entities – it represents the external process of the regular flow. It is in the outside of the system boundaries.
• Resource Store – it represents the flow of the material in the system than the data.
After knowing the basic notations of the Data Flow Diagram we can’t make an efficient Data Flow Diagram if we don’t know the rules in creating one. There are basic rules that must be followed in creating Data Flow Diagram. The rules are classified in two parts according to arifinfo. The two parts of the rules are in drawing and naming in the diagram.
Drawing
• Each process must have input and output. There should not be a process that have no input or output.
• Each store (data storage) has input and output
• It is possible the presence of data storage read-only (read-only)
• There can be no flow of data between stores (storage)
• There should be no flow of data between entities
• The diagram should be balanced at all levels
• The flow of data in and out of context = data flow diagram and out of the diagram 0
• All diagrams parent / child must be balanced
• At each level of the diagram must have a data store
Naming in the Diagram
• All elements must be named
• Use a specific name and meaning
• Data streams are named after the stream of data records, forms, and orders
• Flows that have not been given the name represents a complete record
• Datastore named after all data, records, forms, orders recorded
• The process must be numbered in a hierarchical
• 1.2.4 is a sub process from 1.2
• External entities are named according to what is represented, people, organizations, and other systems.
These rules are given by the arisinfo just basic rules in creating the Data Flow Diagram so that the result of the Data Flow Diagram is organized and every user can understand it. After the rules I had done a design in my previous assessment in that assessment we have made 3 types of the Data Flow Diagram. Knowing the types of the Data Flow Diagram let us understand each function of the flows of the data because there are many types in creating Data Flow Diagram. I had used 3 types of DFD the first type is the Context Diagram, then Physical Diagram and the Logical Diagram. First let us discuss the Context Diagram.
Context Diagram – the highest level in the data flow diagram is this and it is contain only one process that representing the entire system. The diagram does not contain any data stores and the process is will pass on the external entities as well the major data flow.
Physical Diagram – are the technical blueprints for the system construction and implementation. This is the done after crating the logical diagram. It serves as the guide in constructing new system.
Logical Diagram – It will show us how the business operates and it describes the event that will take place, data that will require and how the business will operate.
These are the simple meaning of the 3 types of Data Flow Diagram. Each type has a purpose in building it. Each diagram is use base on the needs of the system on how we will design the system. The next in line is let discuss about the guidelines in creating the Data Flow Diagram. This guideline is based on the article of Jagdish Grangolly.
• No more than 7 – 9 processes in each DFD – for my opinion in this matter I think he include this so that the system that the system analyst or designer is creating is not too long to finish all the process. If there are processes that are redundant in the system it can be merged to the other processes so that the processes are lessen.
• Data flows must begin, end, or both begin & end with a process – this statement is understandable to us because it is so rude to make a Data Flow Diagram that is hanging or no end process. All systems have their beginning and ending process.
• Loops are not allowed – loops in the Data Flow Diagram make the diagram unorganized. If there are processes need to be back to the previous process it is safe to build a new process that conveys the looping process and pack it up with the next process that the process will go on next to.
• Naming Conventions – the author said that naming process we should use strong verbs for the data flows, data stores and external entities we should use for naming are nouns. I think for naming the processes and the other entities in this way make the diagram more organized and easy to understand.
• Data Flows must not be split – For my understanding in this guideline is that when the data is pass to the next process it is not be split to the other processes. It should give only one output and it will direct it to the next process of the diagram.
These are only five of the guidelines that the author wrote in his article. The author mention lots of guidelines but I only pick five that I have understand fully the rest are technically. Following guidelines in making the Data Flow Diagram makes the diagram more understandable and more organized. But let us know the advantages in using Data Flow Diagram. In the article that I have read the author point out only three advantages. And these three advantages are:
• It is a simplified but powerful graphic technique
• It enables representing data with different levels of details.
• It helps defining boundaries of the system
By using Data Flow Diagram set the systems boundaries and the flow of the information that is passing in each processes. Designing the flow of the data will help the developer understand the system and set their work to the needs of the system and the flow of the system. Data Flow Diagram is the backbone of the system because it serve as the blueprint of the developer to come up a better system. Data Flow Diagram is one of the requirements in creating a new system this will not be forgotten in creating a new system.
Now let us get to the main topic of this assessment. The characteristics that the analyst examines in evaluating the Data Flow Diagram are first the flows of the data the analyst must know where the data or the information will after the process. The analyst must be a critical thinker so that the analyst must know the possible risk and make alternatives throughout the risk that he/she found out. The analyst can understand the business flow of the system and the needs of the end user so that he/she can meet the wants of the end user. The analyst must examine the organization of the Data Flow Diagram so that the implementation of the system is well organized too. It is hard to implement when the Data Flow Diagram is not well organized because the flow of the information or data is will not be organized too. The analyst must follow his/her guideline in creating a Data Flow Diagram or must have a guideline to follow so that the flow of the data is well organized. And lastly the analyst must have a background or knowledge in business so that he/she can understand the needs and wants of the end user because when a system analyst is put to work he/she is not only focus on building the system the client needs but to understand the best alternatives that the client will accept.
References:
https://docs.google.com/viewer?a=v&q=cache:FFRxJwIUifMJ:me.emu.edu.tr/ie447/CIMLectureNotes2011.pdf+physical+data+flow+diagram&hl=tl&gl=ph&pid=bl&srcid=ADGEEShjLqCiQvTGoI4QOAHWJLe3e9Cnq2Kk3RargHqtF3nWO63poravErMJmAodpCKOLglCycgvSWxvXoQZAVKSSCPOwJe6IJi4BB_GK-TOEfcdweoD4JZHGSG99lQe6iPCaRmVRv5f&sig=AHIEtbTju2U80s0PCCOejc1XYPoVQf34Gw
http://www.jscgroup.com/physical-data-flow.html
http://www.albany.edu/acc/courses/acc681.fall00/681book/node31.html
http://www.blurtit.com/q808726.html
http://arifinfo.com/2011/06/18/rules-in-creating-data-flow-diagram/
http://www.xamplified.com/data-flow-diagram/
| |
| | | | Joseph Jorge Repaso
Posts : 15
Points : 15
Join date : 2011-11-24
| | Subject: Re: Assignment 10 (Due: February 10, 2012, before 01:00pm) Fri Feb 10, 2012 11:35 am | |
| In the last assignments 8 and 9, we were told to make a data flow diagram of pre-Enrollment system of the University of the Southeastern Philippines. The diagrams I made describe the flow of the pre-enrollment system of the school. In making a data flow diagram, we should first analyze the system thoroughly. A system analyst must know and understand on how to create data flow diagram. When we are evaluating a particular system, we have to analyze each process involve in the system. As what we have said from the previous assignments, a system analyst must know how to analyze and understands. Data flow diagrams can help to explain the flow of the system and its processes. In the assessment, we will discuss about Data flow diagram.
First, let us define Data flow diagram, is a graphical representation of the flow of data through an information system. A data flow diagram can also be used for the visualization of data processing. In the year 1970, data flow diagram was developed and enhanced by the likes of Yourdon, McMenamin, Plamer, Gane and Sarson. It is one of the primary tools of the structured analysis. Now, it is still considered as one of the best modeling techniques for and representing the processing requirements of a system. Data Flow Diagram is also an important technique for modeling a system’s high-level detail by showing how input data is transformed to output results through a sequence of functional transformations. Data flow diagrams reveal relationships among and between the various components in a program or system. A Data Flow Diagram is also a diagrammatic representation of the information flows within a system, showing how information enters and leaves the system, what changes the information and where information is stored.
In making data flow diagrams, there are symbols that we will use. There are rectangular box, arrow headed lines, bubble or circle or round corner square and the narrow opened rectangle.
• Rectangular box - External Entities
- Source or destination of data. The source in a DFD represents these entities that are outside the context of the system. Entities either provide data to the system (referred to as a source) or receive data from it. Entities are often represented as rectangles (a diagonal line across the right-hand corner means that this entity is represented somewhere else in the DFD)
- can be people, departments, other companies, other systems
- are called sources if they are external to the system and provide data to the system, and sinks if they are external to the system and receive information from the system
• Arrow headed lines - Data Flow
- Movement of data between the entity, the process, and the data store. Data flow portrays the interface between the components of the DFD. The flow of data in a DFD is named to reflect the nature of the data used (these names should also be unique within a specific DFD). Data flow is represented by an arrow, where the arrow is annotated with the data name.
- must originate from and/or lead to a process (this means that entities and data stores cannot communicate with anything except processes –remember that it takes a process to make the data flow)
- can go from process to process, but that does imply that no data is stored at that point
- can have one arrowhead indicating the direction in which the data is flowing
- Can have 2 arrowheads when a process is altering (updating) existing records in a data stores.
• Bubble (Circle or round corner square) – Process
- Manipulation or work that transforms data, performing computations, making decisions or logic flow, or directing data flows based on business rules. In other words, a process receives input and generates some output. Process names usually describe the transformation, which can be performed by people or machines. Processes can be drawn as circles or a segmented rectangle on a DFD, and include a process name and process number.
- must have at least one input and at least one output
- at the primitive level are labeled with verb + object (example of this, “print invoice” or “add customer”)
- at the non-primitive level, are labeled more generally (example of this, “customer maintenance” or “warehouse reports”)
• Narrow opened rectangle - Data Store
- Where a process stores data between processes for later retrieval by that same process or another one. Files and tables are considered data stores. Data store names in plural are simple but meaningful, such as “customers,” “orders,” and “products.” Data stores are usually drawn as a rectangle with the right hand side missing and labeled by the name of the data storage area it represents, though different notations do exist.
- data is stored whenever there are more than one process that needs it and these processes don’t always run one after the other (if the data is ever needed in the future it must be stored)
- are labeled with a noun (example of this is the label “customers” indicates that information about customers is kept in that data store)
The basic principle for creating a DFD is that one system may be split into subsystems, which in turn can be disintegrated into subsystems at a much lower level, and so on and so forth. Every subsystem in a Data flow diagram represents a process. In this process or activity the input data is processed. Processes cannot be disintegrated after reaching a certain lower level. Each processes in a Data flow diagram characteristic an entire system. In a Data flow diagram system, data is introduced into the system from the external environment. Once entered the data flows between processes. And then the processed data is produced as an output or a result. When we talk about how information data flows through systems and how that data is transformed in the process, data flow diagrams are the method of choice over technical descriptions for three principal reasons: Data flow diagrams are easier to understand by technical and nontechnical audiences; Data flow diagrams can provide a high level system overview, complete with boundaries and connections to other systems and; Data flow diagrams can provide a detailed representation of system components.
Data flow diagrams help system analyst and others during the planning or the analysis stages visualize a current system or one that may be necessary to meet new requirements. Systems analysts prefer working with data flow diagrams, particularly when they require a clear understanding of the boundary between existing systems and postulated systems. Data flow diagrams represent the following: External devices sending and receiving data; Processes that change that data; Data flows themselves; Data storage location.
According to Hubpages, in using data flow diagram, there are advantages and disadvantages.
Advantages:
- It gives further understanding of the interestedness of the system and sub-systems
- It is useful from communicating current system knowledge to the user
- Used as part of the system documentation files
- Dataflow diagram helps to substantiate the logic underlining the dataflow of the organization
- It gives the summary of the system
- Data flow diagram is very easy to follow errors and it is also useful for quick reference to the development team for locating and controlling errors
Disadvantages:
- A simple but powerful graphic technique which is easily understood.
- Represents an information system from the viewpoint of data movements, which includes the inputs and outputs to which people can readily relate.
- Data flow diagram is likely to take many alteration before agreement with the user
- Physical consideration are usually left out
- Helps to define the boundaries of the system.
- It is difficult to understand because it ambiguous to the user who have little or no knowledge
In making a data flow diagram, there are general rules to follow:
• Any data flow leaving a process must be based on data input to the process.
• All data flows are named; the name reflects that data flowing between processes, data stores, sources and sinks.
• Only data needed to perform the process should be an input to the process.
• A process should know nothing about, that is, be independent of any other process in the system; it should depend only on its own input and output.
• Processes are always running; they do not start or stop. Analysts should assume a process is always ready to function or perform necessary work.
Data flow diagram is a highly effective technique for showing the flow of information through a system. Data flow diagrams are used in the preliminary stages of systems analysis to help understand the current system and to represent a required system. In this way, system analyst can easily understand the flow of the system. By using data flow diagrams, it can explain the flow of the system using visualization. It also helps to find some problems of the system. Data flow diagrams also can help to visualize the data going. It also describes all the process of the system and what the process does. That is why Data flow diagram considered as the best modeling techniques for and representing the processing requirements of a system.
References:
http://dataflowdiagram.blogspot.com/2010/12/rules-for-drawing-logical-dfd.html
http://icttrends.com/what-is-data-flow-diagram-and-what-are-its-symbols.html
http://www.edrawsoft.com/Data-Flow-Diagrams.php
http://oderog.hubpages.com/hub/What-is-a-data-flow-diagram
| |
| | | | brian flores
Posts : 15
Points : 15
Join date : 2011-11-23
| | Subject: Re: Assignment 10 (Due: February 10, 2012, before 01:00pm) Fri Feb 10, 2012 11:52 am | |
| With reference to assignments 8 and 9, what characteristics does an analyst examine when evaluating DFD quality?
A data flow diagram explains business processes and activities in a clear, concise way by illustrating how data flows through the system from one process to another. It is a structured, diagrammatic technique representing external entities, logical storage, data sinks and data flows in the system. Data flow diagrams are used to describe how the system transforms information. They define how information is processed and stored and identify how the information flows through the processes. Furthermore, like other diagrams the data flow helps us to have wider view on the system into more specific information and understanding.
In the assignment 9, we are tasked to make three different types of data flow diagram of the pre-enrollment process of our university. The three types of data flow diagram that I make was the context diagram, logical and physical data flow diagram. For further discussion, I would like to define those types of data flow diagram that I used.
First is the context diagram also known as the diagram 0. The context diagram contains a single process representing the entire system. This DFD that summarizes all processing activity for the system or subsystem and the diagram shows important interactions between the system and the external agents. System scope is represented by a single process, external agents, and all data flows into and out of the system. Documenting the system’s boundaries by drawing a context diagram helps the analyst, the user, and the responsible managers visualize alternative high-level logical system designs. It focuses on the business and how the business operates. It describes the business events that take place and the data required and produced by each event.
Second is the physical data flow diagram that shows the specifics of a particular system. It uses data flow diagram symbols to represent the system’s physical processes (programs, manual procedures) and physical data stores (files, databases, reports, screens, etc.) and shows how the system works. Some analysts like to start the analysis process by preparing a physical data flow diagram of the present system.
Lastly is the logical data flow diagram shows the system requirements under the assumption of perfect technology. A process might eventually be implemented as a computer program, a subroutine, or a manual procedure. A data store might represent a database, a file, and a book, a folder in a filing cabinet, or even notes on a sheet of paper. Data flows show how the data move between the system’s components, but they do not show the flow of control. The idea is to create a logical model that focuses on what the system does while disregarding the physical details of how it works.
When building a data flow diagram, the following items should be considered such as where does the data that passes through the system come from and where does it go, what happens to the data once it enters the system and before it leaves the system, and what delays occur between the inputs and outputs. There are five components parts used of designing a DFD, this are follows,
• Process – represents an algorithm for transforming data input into data output
• Data flow – represents the movement of data among processes, data stores, and external agents
• External agent – represents a person of organization outside the scope and control of the system that provides data inputs and/accepts data outputs
• Data store- data at rest, awaiting future access by a process or between process invocations
• Real- time link – a special type of data flow representing two-direction data movement between a process and an external agent as the process is executing.
A high-quality set of data flow diagram is readable, is internally consistent, and accurately represents system requirements. Accuracy of representation is determined primarily by consulting users and other knowledgeable stakeholders. A project team can ensure readability and internal consistency by applying a few simple rules to DFD construction like the seven plus/minus two rule that reduces information overload. Analysts can apply these rules while developing the DFDs or during a separate quality check after preparing DFD drafts.
Data Flow Diagram Principles
1. A system can be decomposed into subsystems, and subsystems can be further decomposed into lower level subsystems.
2. Each subsystem represents a process or activity in which data is processed.
3. At the lowest level, processes can no longer be decomposed.
4. Each 'process' has the characteristics of a system. A process must have input and output.
5. Data enters the system from the environment, data flows between processes within the system and data is produced as output from the system.
Data Flow Diagram Rules
1. Any data flow leaving a process must be based on data that are input to the process.
2. All data flows are named and the name reflects the data flowing between processes, data stores, sources, or sinks.
3. Only data needed to perform the process should be an input to the process.
4. A process should know nothing about, that is, be independent of, any other process in the system, it should depend only on its own input and output.
5. Processes are always running, they do not start or stop. Analysts should assume that a process is always ready to function or perform necessary work.
6. Output from processes can be an input data to other process, modified data such as change of status and change of content.
In making a logical DFD, data should not be needlessly passed into a process. The following consistency rules can be derived from the all data that flows into a process must flow out of the process or be used to generate data that flows out of the process and all the data that flows out of a process must have flowed into the process or have been generated from data that flowed into the process.
An analyst can often detect errors and omissions in a set of data flow diagram by looking for specific types of inconsistency. Three common and easily identifiable consistency errors are as follows, differences in data flow content between a process and its process decomposition, data outflows without corresponding data inflows, and data inflows without corresponding outflows. To avoid this errors the analyst must be careful to look at the components of data flows, not just data flow names. For this reason, detailed analysis of balancing should not be undertaken until data flows have been fully defined. Balance the data content between data flows entering and leaving a process and data flows entering and leaving decomposition DFD.
It is essential to evaluate all DFDs carefully to determine if they are correct. Errors, omissions and inconsistencies can occur for several reasons, including mistakes in drawing the diagrams. But the presence of what appears to be an error may in fact point out a deficiency in the system or a situation in which users are not aware of how certain processes operate.
These questions that I found from a particular blog-site are useful in evaluating data flow diagrams:
• Are there any unnamed components in the data flow diagram (data flows, processes, stores, inputs or outputs)?
• Are there any data stores that are input but never referenced?
• Are there any processes that do not receive input?
• Are there any processes that do not produce output?
• Are there any processes that serve multiple purposes? If so, simplify by exploding them into multiple processes that can be better studied).
• Are there data stores that are never referenced?
• Is the inflow of data adequate to perform the process?
• Is there excessive storage of data in a data store (more than the necessary details)?
• Is the inflow of data into a process too much for the output that is produced?
• Are aliases introduced in the system description?
• Is each process independent of other processes and dependent only on the data it receives as input?
As a system analyst it is important to create an effective, readable, consistent, and accurate data flow diagram for the stakeholders of the project easily understand the system. Therefore system analyst should evaluate and consider all the items, data and important aspects that can be seen in the data flow diagram such as data stores and multiple processes in the context diagram, missing customer inquiry data flow, no outgoing or incoming data flows from data stores, overloading of data flows, inconsistencies, naming, and additional data store. The following are the summarized task of a system analyst in making a data flow diagram
• Understand the business requirements of the target system.
• Identify the business processes of the target system.
• Prepare a high level business design.
• Present and review the completed high level business process design with the Project Manager.
• If any corrections are needed, revise the high level business process design.
• Conduct a walkthrough with the Technical Reviewer and Developer to go over the requirements and high level design.
• Present the completed data flow diagrams of the target system to the Project Manager for signoff.
http://dataflowdiagram.blogspot.com/2010/12/data-flow-diagram-how-to-evaluate-dfd.html
http://me.emu.edu.tr/ie447/CIMLectureNotes2011.pdf
http://www.engr.sjsu.edu/fayad/current.courses/cmpe202-spring07/docs/projects/Sample-Process-2.pdf
http://www.docstoc.com/docs/69651149/Chapter-6
https://docs.google.com/gview?url=http://www.caesar.unsw.edu.au/publications/pdf/Tech99-3.pdf&chrome=true
| |
| | | | Alexander Manlod

Posts : 22
Points : 22
Join date : 2010-07-30
Age : 32
Location : Davao City
| | Subject: Re: Assignment 10 (Due: February 10, 2012, before 01:00pm) Fri Feb 10, 2012 12:05 pm | |
|
We were tasked to create an use case diagrams, activity diagrams, use case descriptions which is fully developed and 3 unlikely data flow diagrams for the pre enrollment system of usep for the last to assignment we had. Apparently, for this activity, we were tasked to know the characteristics does an analyst examine when evaluating DFD quality. For the previous chapter, we can see the data and information about the school. During our observation we gathered data and information about the problems that the school is facing nowadays. You can see the results of the research that we had during the observation inside their premises. Also, you will understand why they need to have in their business process pre enrollment system.
We presented the functional requirements according to User Classifications. This functional requirement defines a function of a system or its component. A function is described as a set of inputs, the behavior, and outputs. It can be a data manipulation and processing and other specific functionality that define what a system is supposed to accomplish.
We presented also the different users of the proposed system and their roles or responsibilities in the system of the school. By use cases and diagrams in this chapter, we can identify what system functions are performed for which actor. Roles of the actors in the system can be depicted.
We also fully developed a use case description of usep pre enrollment system. such as: the admission office, we place it at the high priority and the primary actor is the student which he or she must provide the requirements of the university as an application for admission. The pre condition of it is the requirements of the university handles the requirements of application of the student which triggers to complete and approved requirements taken by the university guidance and testing office. The post condition of it is the ugto will be assigned to keep the records of the students who applied. There is also an important event of usep pre enrollment, the examination which defines on high priority and of course the primary actor is the student who are taking exam for the university. The student must take or undergo the examination of the university to know and check the abilities and how far can the student go or the abilities and capabilities of the student. The pre student condition of the student is the student must pay the examination fees to the cashier which triggers the ability of the student and how competent he or she is. The post condition of it is the student must get the result to the university guidance and testing office to know if he or she is necessary to take and undergo English bridge program or not. In EBP or English Bridge Program of the University, the priority of this is high and the primary actor is of course the student. By this, if the student didn’t make it for the entrance examination or he or she have taken a low grade on the subject English, the university requires him or her to undergo and take the English Bridge Program. It means that the university is not satisfied of your performance as you take the exam. The precondition of it is the student must acquire the date and time which given by the university guidance and testing office or the schedule of the exam which triggers the event of the university did the satisfied the rating of how you handle English subjects. After taking the English bridge program, you can get your certificate which certifies that you have pass the English bridge program.
Knowing the disadvantages will really help the usep pre enrollment system to work better and give faster services than the manual process. Manual process has many disadvantages. These are the disadvantages: Inconsistency of data which sometimes there is a duplication of data or wrong information that was written by the employee. Less security which the data might be misplaced or affected by the fire, flood and any disasters. Difficult to retrieve data, when the file will be affected in any accident like fire or flood, it is difficult to retrieve all the data that was written in the papers. It might be ashes already or get wet that cause it unreadable. Lot of errors: some employees get many mistakes in writing the information of the student. Difficult to search data: since there are many papers of all the information of the student, it takes too much time to scan the file and look for certain information. Archive system can organize information of books. There’s no need to write down anymore because in their archiving system you will just encode all the information of the students so it will not time consuming anymore. It is important also to avoid errors, redundancy of data and other disadvantages of manual process. It is a big help to a school because it gives faster services.
,systems analysis is defined as those phases and activities that focus on the business problem (USEP SYSTEM) and independent of technology (for the most part). Specifically, we refine our definition of systems analysis as follows. Systems analysis is the survey and planning of the system and project, the study and analysis of the existing business and information system, and the definition of business requirements and priorities for a new or improved system. The phase configure a feasible solution would be considered part of systems analysis by some experts. i prefer to think of it as an analysis-to design transition phase. Systems analysis is driven by business concerns, specifically, those of system users. Hence, it addresses the data, process, interface, and geography building blocks from a system user perspective. Emphasis is placed on business issues, not technical or implementation concerns. This means that phases (and activities included in phases) communicate across a shared repository.
We discussed about the architectures and diagrams that we had created and why we chose this kind of diagrams and structure. We provided all the benefits that we can get from the architecture. In diagram, we presented the normalized data that usually take events as pre enrollment system of usep process, and also a short discussion about the tables/entities that provides object view of a database. To show what diagram look like, visit my blog.
As what I have observed as a student of university of southeastern Philippines, I can define a lot of problems that the university is facing now such as The data storage as well as the order file is in accurate and unreliable which Data are disarranged and labeled in the same file name andDisarranged data can cause confusion especially to the user. The system must provide and make The data is well arranged and easy to find. The system gives accurate data information and The data storage or the order files is well arranged in the database. The user can easily locate the data they need. There is also a lack of system management and decision making information and The system is not user friendly and it is hard to use and The end user fined it hard to use the system and it can waste time. The developer of the systems of usep must generate The system to be easy to learn because it is user friendly so that There is no waste of time among user. The new system provides easy to learn functions and ease hands on and testing confusion. Some of The data or information is being updated and stored manually. They do not have system that automatically generates and update data which Time is wasted in manual updating of data. The future system must automatically updates and generates information needed also, The new system has feature that automatically stored data and update data or information. The system also provides easy generating of information needed. Also, There is a problem on system maintenance, automatic identification. As what I have observed, there is No proper monitoring of the system. The system can access data or it may be cause to downfall. For the future and better system, developer must ensure that There is a proper monitoring in the system to prevent downfall. The maintenance in the system can be performed everytime. T he new system must always monitored and has its proper maintenance and It automatically sends information to the admin if there are dependencies. As well as There is system incompatibility and there are problems in order files which The system doesn’t support or hard to commence compatibility which the information or file are disarranged and may lead to user confusion. The system must provides an easy update of data and sorting of files and The new system supports data incompatibility and works within the given format and The data or information stored and retrieved by the system is automatically ordered. Any data stored or any new developed system must be compatible with the existing system. I also observed that There is no strong security; the data can be viewed by anyone. The system has no precautionary measures or it does not have the capability of hiding confidential data.
| |
| | | | kevinmendez
Posts : 15
Points : 15
Join date : 2011-11-23
| | Subject: Assignment 10 Fri Feb 10, 2012 12:28 pm | |
| As I have search different Data Flow Diagram for creating a representation of USeP’s pre-enrollment system, I have discovered that there are easy or summarize representation of Data Flow Diagram of pre-enrollment system and a difficult or detailed representation of the said evaluation. The Physical Data Flow Diagram shows the detailed flow of the process of pre-enrollment system of USEP and what part of the system does the student store their important data for their application. This Physical Data Flow Diagram includes the process of data processing for showing where in the part of the system did the data flows in the system. Data storage is very important in all kinds of business and organizational system because all of the transactions are all process by data and information. Because it is detailed, it can easily a find out the actual process if the pre-enrollment system.
Data Flow Diagrams are just one of the basic models being used by system analysts in representing important aspects of the system. Data Flow Diagrams have differing characteristics and these facts are difficult to explain and point out and it is also visualize by the system analyst who is studying the procedures of the system. A system analyst must be dedicated to his work because it is very important behavior that he must possessed for him to properly done in studying the system. A system analyst must figure out the problem of the complexity of the system for him to create a solution based on the figures on data flow diagrams. And because of the complexity of the system, the analyst must have the aim for accuracy and completeness of the studied system. The analyst must be able to define the exact events that involved and taking place within the activities of the system to be able to find out the components of the data flow diagram, and he must be able to capture the overall process of the present system and create a high level data flow diagram where the general overview of the system is modeled out. The analyst must familiarized the whole system of the organization and the whole process of the specific system for him to expand more the general view of the system and create a more detailed data flow diagram and combining with data flow diagram fragments into process. But before creating a high level diagram of the system, the analyst must first create a draft of context diagram of the system so that it can always reviewed by every study that an analyst creates every time he upgrades the whole system into a high level diagram.
Data Flow Diagrams (DFDs) have two types; it is either Logical Data Flow Diagram or Physical Data Flow Diagram. A Logical Data Flow Diagram focuses on the businesses and organizational structures and how the business and organizations operates and it illustrates the business and organizational events that take place and the data required and produced by each result. It shows how the business and organizations operates and their business and organization activities. It has collections of data, regardless of how the data is stored, showing the representation of permanent data collections and showing data controls. The Logical Data Flow Diagram is somewhat the summarize representation of USEP’s pre-enrollment system because it only shows the activity and the process of the object to the whole system. It can be read by any person who knows Logical Data Flow Diagram. A Logical Data Flow Diagram’s symbols are used to describe logical entities and the process might be implemented as a computer program, a subroutine, or a manual process. The storage of data may represent a database, a file, and a book, a folder in a filing cabinet, or even notes on a sheet paper. The flow of data shows how the data move between the system’s components but they do not show the flow of control. The Logical Data Flow Diagram is the one who creates a logical model that determines what the system does and disregards the physical details on it works.
The Physical Data Flow Diagram shows how the system will be implemented and it also represents how the current system operates in their whole system. It shows programs, program modules and manual procedures. It has physical files and databases, manual files. The types of data storage are master files and transaction files. Any processes that operate at two different times must be connected by a data store. It shows controls for validating input data for obtaining a record and ensuring successful completion of a process and for system security. Ideally, systems are developed by analyzing the current system (the current logical DFD), and then adding features that the new system should include (the proposed logical DFD). Finally the best methods to implement the new system should be developed (the physical DFD). After the logical model for the new system has been developed, it may be used to create a physical data flow diagram for the new system. The Physical Data Flow Diagrams are a means to an end, not an end in themselves. They are drawn to describe the performance of the present system so that it ensures the correct understanding of the present implementation of the system, the users are generally better able to discuss the physical system as they know it through people and workstations, and the present implementation of the system may be a problem or limiting factor and changing the implementation. It also implements dependent view of the present system showing every task that is carried out and how they are performed. The physical characteristics of Physical Data Flow Diagram are the names of people, forms and document name, names of department, master and transaction files, equipments and devices used, and locations. The Physical Data Flow Diagrams is drawn in the form of a diagram and creates a model of technical and human design decisions to be implemented as part of an information system. Their main purpose is to communicate technical choices and other design decisions to those who will actually construct and implement the system. The physical data flow diagrams are technical blueprints for system construction and implementation. The Physical Data Flow Diagram uses data flow diagram symbols to represent the system’s physical processes (programs, manual procedures) and physical data stores (files, databases, reports, screens, etc.) and shows how the system works. Some analysts like to start the analysis process by preparing a physical data flow diagram of the present system. Following the analysis stage, physical data flow diagrams can be used to document alternative solutions. The most complete and useful approach in developing an accurate and complete description of the current system begins with the development of a physical data flow diagram because it is desirable for the analysts in initially find it easier to describe the relationship between the physical components than to understand the procedure used in managing the application. Identifying people, what they do, which documents and forms trigger which activities and what equipment is used in the processing, and the movement of people, documents and information between departments and locations is also identified. The Physical Data Flow Diagrams are useful for communicating with users. Users communicate easily to people, locations and documents as they work with these each day. Users may consider Logical Data Flow Diagrams as abstract as they do not contain these familiar components while with Physical Data Flow Diagrams users can quickly identify incorrect or missing steps. The Physical Data Flow Diagrams provide a way to validate or verify the user's current view of the system with the way it is actually operating.
Context Diagram is the summarized representation of Data Flow Diagram because it shows the whole system and the whole process of the system. All the process is already listed in the represented diagram. It is simple as other different diagrams but it already shows the entire sequence of the process of the system. The context diagram is the highest level in a data flow diagram and contains only one process, representing the entire system. The process is given the numb external entities are shown on the context diagram, as well as major data flow to and from them. The diagram does not contain any data stores.
The quality of the data flow diagram that an analyst must create is to make sure that it should be understandable to other readers of the diagram of the system. There are maybe people or individual who are not studying information systems and may not have knowledge about these matters but it is important to know that they must also be able to comprehend the flow of the actual system as what and how the model describes, and it has to be internally consistent and balanced. A data flow diagram would not be able to explain a well-defined structure and process of the system if it is not balanced and it should be internally consistent. And the most important and crucial in the data flow diagram is that it must accurately represent the system requirements because its goal is to characterize the procedure and the in and out flow of data in the running system.
Reference:
http://me.emu.edu.tr/ie447/CIMLectureNotes2011.pdf | |
| | | | Nelly C. Ancajas

Posts : 15
Points : 15
Join date : 2011-11-23
Age : 33
Location : Tibungco Davao City
| | Subject: Assignment 10 Fri Feb 10, 2012 1:10 pm | |
| With reference to assignments 8 and 9, what characteristics does an analyst(you) examine when evalauating DFD quality? (1500 words) As an introduction to the assignment ten, base on the assignment eight and nine we are task to make an UML Unified Modeling Diagram-different diagrams that can illustrate a process or system, in our case we are task to illustrate the pre-enrollment of University of Southeastern Philippines. In assignment eight we are task to develop an activity diagram and a fully developed description for a use case. Activity Diagrams are usually used to a business process model, for modeling the logic captured by a single use case of a business or a system, it is also for modeling the detailed logic of a business rule or the rules of the system how it works. Creating activity diagrams are very useful in describing the flow control of the target system. It is also helpful in determining the use cases and the business processes of a company or a system that a company may use. With the assignment nine we are task to create at least 3 different types of Data flow diagram of USEP's pre-enrollment system. First we defined what data flow diagram is all about. Data flow diagram is a graphical representation of data on how the process goes in the system or business. According to Scott W. Ambler data flow diagram shows the flow of the data from external entities into the system, how the data moved from one process to another as well as its logical storage. Data flow diagram can also be used for the visualization of data processing. A Data flow diagram provides no information about the timing of processes, or about whether processes will operate in sequence or in parallel. It is therefore quite different from a flowchart, which shows the flow of control through an algorithm, allowing a reader to determine what operations will be performed, in what order, and under what circumstances, but not what kinds of data will be input to and output from the system, nor where the data will come from and go to, nor where the data will be stored. Also according to Hoffer, George and Valacich there are two defined data flow diagrams, includes context diagram and level-O diagrams. To differentiate, context diagram is a data flow diagram (DFD) of the scope of an organizational system that shows the system boundaries external entities that interact with the system and the major information flows between the entities and the system. On the other hand, level-O diagram is a data flow diagram (DFD) that simply represents a system’s major processes, data flows and data stores at a high level detail.
The data flow diagram has a purpose and it provide the meaning between users and systems developers. And it diagrams are first graphical, eliminating thousands of words; second is logical representations, modeling WHAT a system does, rather than physical models showing HOW it does it; third is hierarchical, showing systems at any level of detail; and allow the user to understand review the process.
There are characteristics examined in evaluating the data flow diagram. First is Remember, also referred to as recognition or recall. Be able to remember or recognize terminologies, definitions, facts, ideas, materials, patterns, sequences, methodologies and principles. Second is to Understand. Will be able to read and understand descriptions, communications, reports, tables, diagrams, directions and regulations. Third is to Apply. Be able to apply the ideas, procedures, methods, formulas, principles, theories and to the related situation that can be apply on the diagram. Fourth is Analyze. To be able to break down information into its constituent parts and recognize the parts’ relationship to one another and how they are organized; understand the data’s from a complex process. The fifth one is to Evaluate. To be able to make judgments regarding the value of proposed ideas, solutions, methodologies, and many more by using the proper standards to estimate accuracy, effectiveness, economic benefits, and many more. The last one is to Create. Be able to identify which data or information from a complex set is appropriate to examine further or from which its supported conclusions can be drawn.
Data flow diagram has the following symbols: Process flow diagrams. It has the following entities, process number, where the activity is happening and its process name. Data flow datagram. It symbolizes the transformation of data, there must be data flowing into/out of the process, process can have several inputs to it or output to it and process with no out becomes a null process. Data store Symbol. Consist of the following entities, data store number and name of data store. The function of data store is to designate the storage of data in a DFD diagram. Rules of Data store-First rule is that the data flow diagram data store do not by level but they may reappear incase needed and secondly that the symbol and the numbering remain the same. Data flow symbol. Data flow symbol may appear in different shape and they signify the movement of data. They do not signify the movement of people, goods. Doubles an arrow signifies that activities occur at the same time which is wrong and Data flow in is never equal to data flow out. Extended entity symbol. Extended entity is sources and destination of data. This means that source is the origin and destination is the sink of data.
Dos and Don’ts of external entity • External entity never communicate with each other, this signify that there is no need for the process • External entity should not communicate directly with data store because external entities can be identifier with the record of files and databases How to develop Logical data flow diagram Below are the guidelines in developing data flow diagrams 1. Develop a physical DFD 2. Explore the process for more details 3. Maintain consistency between the process 4. Following meaningful leveling convention 5. Ensure that DFD diagrams clarifies what is happening in the system 6. Remember DFD audience 7. Add control on the lower level DFD only 8. Assign meaningful level 9. Evaluate DFD for correctness Step in drawing DFD diagrams 1. Make a list of all business activities and use it to determine the various external entities, data flows, process and data store 2. Create a context diagram which shows external entity and data flows to and from the system 3. Do not show any detailed process or data store 4. Draw diagram zero or the next level to show process but keep them general. Show data stores and the level 5. Create a child diagram for each of the process in diagram zero 6. Check for errors and make sure the levels you assign to each process and data flow are meaningful 7. Develop a physical DFD diagram from the logical DFD and distinguish between the manual and automated protocol, describe actual files and report by name and controls to indicate when the process are complete or errors occurs 8. Portion the physical DFD by separating or grouping parts of the diagram in order to facilitate programming and implementation Advantages of data flow diagrams • It gives further understanding of the interestedness of the system and sub-systems • It is useful from communicating current system knowledge to the user • Used as part of the system documentation files • Dataflow diagram helps to substantiate the logic underlining the dataflow of the organization • It gives the summary of the system • DFD is very easy to follow errors and it is also useful for quick reference to the development team for locating and controlling errors Disadvantages of data flow diagram • DFD is likely to take many alteration before agreement with the user • Physical consideration are usually left out • It is difficult to understand because it ambiguous to the user who have little or no knowledge. Data Flow Diagram Principles * The general principle in Data Flow Diagramming is that a system can be decomposed into subsystems, and subsystems can be decomposed into lower level subsystems, and so on. * Each subsystem represents a process or activity in which data is processed. At the lowest level, processes can no longer be decomposed. * Each 'process' (and from now on, by 'process' we mean subsystem and activity) in a DFD has the characteristics of a system. * Just as a system must have input and output (if it is not dead), so a process must have input and output. * Data enters the system from the environment; data flows between processes within the system; and data is produced as output from the system 1. A system can be decomposed into subsystems, and subsystems can be further decomposed into lower level subsystems. 2. Each subsystem represents a process or activity in which data is processed. 3. At the lowest level, processes can no longer be decomposed. 4. Each 'process' has the characteristics of a system. A process must have input and output. 5. Data enters the system from the environment, data flows between processes within the system and data is produced as output from the system. General Data Flow Rules 1. Entities are either 'sources of' or 'sinks' for data input and outputs - i.e. they are the originators or terminators for data flows. 2. Data flows from Entities must flow into Processes 3. Data flows to Entities must come from Processes 4. Processes and Data Stores must have both inputs and outputs (What goes in must come out!) 5. Inputs to Data Stores only come from Processes. 6. Outputs from Data Stores only go to Processes. Now, back to the main question, what characteristics does an analyst (you) examine when evaluating DFD quality? To be honest, I really had a hard time thinking of how to create good and perfect data flow diagrams. But with the guidelines above information that is mentioned I think I can evaluate A data flow diagram. References: http://hubpages.com/hub/What-is-a-data-flow-diagram http://www.agilemodeling.com/artifacts/dataFlowDiagram.htm http://www.asq.org/certification/quality-process-analyst/bok.html http://www.cmp.jobs/qa-analyst-1153.php http://spot.colorado.edu/~kozar/DFDtechnique.html | |
| | | | Louie_P_Sanchez
Posts : 15
Points : 15
Join date : 2011-11-24
| | Subject: Assignment 10 Fri Feb 10, 2012 1:26 pm | |
| In this article I will tackle about what characteristics does an analyst examine when evaluating a DFD quality. In our previous assignments we are assigned to make a Data Flow Diagram. But before going to the point I will discuss first what a DFD or Data Flow Diagram is and what are its qualities, the steps in creating a Data Flow Diagram and the symbols of a data flow diagram.
What is a Data Flow Diagram?
A DFD or a Data Flow Diagram is a graphical representation that portrays information flow and shows the transforms that are applied as data move form input to input. In other words Data Flow Diagram is a geographical tool that shows, process, flows, stores and external entities in a system. Data Flow Diagram shows the transformation of data into a system. The basic form of Data Flow Diagram is also known as a data flow graph or a bubble chart. The data flow diagram may be used to represent a system or software at any level of abstraction. In fact, DFDs may be partitioned into levels that represent increasing information flow and functional detailed. Therefore, the DFD provides a mechanism for functional modeling as well as information flow modeling. In process flow diagrams, process symbol has got the following entities, process number which tells the number of process, and locality where activity is happening and also the process name. According to some information Data flow diagram process symbol rules symbolize the transformation data. There must be a data flowing into/out of the process. Data Flow Diagram is categorized as either logical or physical. A logical DFD focuses on the business and how the business operates. It describes the business events that take place and the data required and produced by each event. On the other hand, a physical DFD show how the system will be implemented as we mentioned before. Ideally, systems are developed by analyzing the current system and when we add the new features to the new system the DFD will be used is the logical type but finally the best methods to implement the new system should be developed using the physical Data Flow Diagram.
Symbols of a Data Flow Diagram
There are only four symbols used to write the Data Flow Diagram as, this are the symbols:
Process - Rectangular Box
Processes are drawn as rectangular boxes; processes are transformations, changing incoming data flows into outgoing data flows. Rectangular boxes has a descriptive name occupying the middle of the box and also it has a top stripe that contains the identification number in the left and the location or the role
carrying out the work on the right, this is optional and used only in the current physical DFD.
Arrow Headed Lines – Data Flow
Double headed arrows can be used (to show two-way flows) on all but bottom level diagrams. Furthermore, in common with most of the other symbols used, a data flow at a particular level of a diagram may be decomposed to multiple data flows at lower levels.
External Entity – Bubble (circle or round corner square)
An external entity is a source or destination of a data flow which is outside the area of study. Only those entities which originate or receive data are represented on a business process diagram. The symbol used is an oval containing a meaningful and unique identifier.
Data Store – Narrow opened rectangle
A data store is a holding place for information within the system: It is represented by an open ended narrow rectangle. Data stores may be long-term files such as sales ledgers, or may be short-term accumulations: for example batches of documents that are waiting to be processed. Each data store should be given a reference followed by an arbitrary number.
According to some information these are some of the elements of a Data Flow Diagram.
Resource Flow
A resource flow shows the flow of any physical material from its source to its destination. For this reason they are sometimes referred to as physical flows. The physical material in question should be given a meaningful name. Resource flows are usually restricted to early, high-level diagrams and are used when a description of the physical flow of materials is considered to be important to help the analysis.
Data Stores
In some of the information, the store should be given a reference letter, followed by an arbitrary number. These reference letters are allocated as ‘D’ that indicates a permanent computer file, ‘M’ that indicates a manual file and ‘T’ that indicates a transient store, one that is deleted after processing. Most important thing is that in order to avoid complex flow, the same data store may be drawn several times on diagram. Multiple instances of the same data store are indicated by a double vertical bar on their left hand edge.
Processes
When naming processes we should avoid glossing over them, without really understating their role. Indications that this has been done are the use of vague terms in the descriptive title area - like 'process' or 'update'. The most important thing to remember is that the description must be meaningful to whoever will be using the diagram.
External Entities
It is normal for all the information represented within a system to have been obtained from, and/or to be passed onto, an external source or recipient. These external entities may be duplicated on a diagram, to avoid crossing data flow lines. Where they are duplicated a stripe is drawn across the left hand corner, like this. The addition of a lowercase letter to each entity on the diagram is a good way to uniquely identify them.
Characteristics of an Analyst in Examining a DFD Quality
This time I will tackle about what are the characteristics an analyst should developed or should have in examining a DFD quality. After defining what a DFD is, what the steps in making a DFD are or how to create, what are the symbols of a DFD and what are its qualities, I came up with an answer that an analyst should have an interest of what he/she is doing because no one can successfully make a data flow diagram if he/she does not have an interest because we can make the diagram if we will have an interest in making it, another characteristic is an analyst should be observant. Being a good observant is one of the best characteristic an analyst should have in making DFD because when we observe well the flow of the system of the company we can make the proper and the appropriate DFD for it, by observing we can surely tell whether this man is in this kind of work or what are the different roles of the people in the company or in the system. Another important thing is an analyst should make sure that the DFD is understandable to the people, because it is very important that a DFD should be clear to the people around the system in order for them to know the process and the flow of their system well and also they must be able to understand the actual movement of the system and how the model describes it. An analyst is requires also to accept proposals or corrections in order to know the ideas of the people that are being surrounded in the system. Another important thing is an analyst should generate the maximum solution of the problem, he/she must be able to explain the logic solutions, and also an analyst should always evaluate the data flow diagram for accuracy or perfection and the most important thing an analyst should develop is he/she must willing to communicate to the people writing or orally, he/she must get along with them and he/she must be a good listener in order to feel the reaction of the people. And according to my article or according to my previous assignments, an analyst is not expected to be good in the aspects of programming, the most important thing is he/she must have a general knowledge in the concepts and terms and the essentials of the system. And most importantly an analyst should be business minded.
Conclusion
To sum it all up or to generalize what are the characteristics of an analyst in examining a Data Flow Diagram quality. He/she must have a good background of what are the systems that existed and he should also be able to identify what are those processes that a system must have with regarding to the goals of the organization. And he must have enough background on what is their business processes. Good communication skills as well as good critical thinking. And also an analyst must gather important information in order to have sufficient information in making a DFD. And lastly, being able to adapt to change, as we all know we are in the fast changing world or era. Well, that’s it. These are the characteristics that a good system analyst must have in order to evaluate the Data Flow Diagram quality.
| |
| | | | Robert Alan Gemong
Posts : 24
Points : 24
Join date : 2010-07-25
Age : 32
| | Subject: Re: Assignment 10 (Due: February 10, 2012, before 01:00pm) Fri Feb 10, 2012 1:47 pm | |
| In this article, with reference to assignments 8 and 9, which are the activity diagram and the data flow diagram, respectively, we are going to identify what characteristics do the analyst like me examines when evaluating DFD quality. In our previous assignment, we are tasked to illustrate the pre-enrollment by creating activity diagram and a data flow diagram of our school, University of Southeastern Philippines. In assignment 8 in which we are tasked to develop an activity diagram and a fully developed description for a use case, we create a detailed logic of the business process of the University. I find this assignment very useful, because it helps the analyst in describing the flow control of the target system. It is also helpful in determining the use cases and the business processes of a company or a system that a company may use. In our assignment 9, we are tasked to develop a Data flow diagram of USEP's pre-enrollment system of at least 3 different types.
In this assignment, to identify what characteristics do the analyst like me examines when evaluating DFD, first, I want to discuss what DFD is all about. According to about-knowledge.com, A Data Flow Diagram (DFD) is a graphical representation that depicts the flow of information. Data flow diagram can be used to represent software or a system of abstraction at any level. In fact, data flow diagrams can be partitioned into levels that represent increasing flow of information and detail of functional. Therefore, the diagram provides mechanism for function models as well as information flow models. A level 0 DFD, which is also called as a fundamental system model, represents the software element as bubble with input and output information illustrated by incoming and outgoing arrows. As the data moves through the system, it is modified by a series of transformations. In additional, data flow diagram has got the following symbols. In Process flow diagrams, process symbol has got the following entities, process number (tells the number of the process), locality (where activity is happening) and a process name. Data flow datagram process symbol rules symbolizes the transformation of data. There must be data flowing into/out of the process. Process can have several inputs to it or output to it. Process with no out becomes a null process. Data store symbol consist of the following entities, data store number and name of data store. The function of data store is to designate the storage of data in a data flow diagram. Data flow symbol may appear in different shape and they signify the movement of data. They do not signify the movement of people, and goods. Doubles arrows signifies that activities occur at the same time which is wrong. Data flow in is never equal to data flow out. In Extended entity symbol, extended entity is sources and destination of data. This means that source is the origin and destination is the sink of data. There are Dos and Don’ts in external entity. External entity never communicate with each other, this signify that there is no need for the process. External entity should not communicate directly with data store because external entities can be identifier with the record of files and databases. There are two main types of analysis. The structured analysis and the object oriented analysis. The main phases of Structured Analysis are as follows: Requirements determination, structured modeling, Data modeling, and Alternative solution generation. The main phases of Object Oriented Analysis are as follows: Requirements determination, Object oriented modeling, Data modeling, and Alternative solution generation. The main sources from which the analyst can gather requirements are books, journals, people, current system documentation, websites, and articles. Break the business rules. For example, there is a rule that an organization can only use standalone system for all of its branches because of security reasons and an analyst can convince them to use online system having Internet securities.
How to develop Logical data flow diagram
Below are the guidelines in developing data flow diagrams
1. Develop a physical DFD
2. Explore the process for more details
3. Maintain consistency between the process
4. Following meaningful leveling convention
5. Ensure that DFD diagrams clarifies what is happening in the system
6. Remember DFD audience
7. Add control on the lower level DFD only
8. Assign meaningful level
9. Evaluate DFD for correctness
Step in drawing DFD diagrams
1. Make a list of all business activities and use it to determine the various external entities, data flows, process and data store
2. Create a context diagram which shows external entity and data flows to and from the system
3. Do not show any detailed process or data store
4. Draw diagram zero or the next level to show process but keep them general. Show data stores and the level
5. Create a child diagram for each of the process in diagram zero
6. Check for errors and make sure the levels you assign to each process and data flow are meaningful
7. Develop a physical DFD diagram from the logical DFD and distinguish between the manual and automated protocol, describe actual files and report by name and controls to indicate when the process are complete or errors occurs
8. Portion the physical DFD by separating or grouping parts of the diagram in order to facilitate programming and implementation
Advantages of data flow diagrams
• It gives further understanding of the interestedness of the system and sub-systems
• It is useful from communicating current system knowledge to the user
• Used as part of the system documentation files
• Dataflow diagram helps to substantiate the logic underlining the dataflow of the organization
• It gives the summary of the system
• DFD is very easy to follow errors and it is also useful for quick reference to the development team for locating and controlling errors
In evaluating the DFD’s quality, I have identified some of the good characteristics of it. Data Flow Diagram must be readable. In order to attain the principal use of the DFDs, it should be readable enough to understand the data flow of the system. Another characteristic of is the Non-complex DFDs. Most of the complex systems come from complex plan on the data flow. Third is the Consistency of the DFDs. Inconsistencies in the DFD can result to a dilemma in developing the system. First problem would occur on the members of the team in developing the system.
Basically, the system analyst must have an excellent background of what are the systems that exist. An analyst should be knowledgeable on how to define the process on a Data flow diagram. He/ she understand every details of the diagram. He/ she correctly identify the decision variable. A system analyst plays a major role in a project team which works primarily for an information system. A Systems Analyst serves as a business professional who uses analysis and design techniques to solve business problems using information technology. As we all know information technology is the study, design, development, implementation, support or management of computer-based information systems, particularly software applications and computer hardware, which deals with the use of electronic computers and computer software to convert, store, protect, process, transmit, and securely retrieve information. A systems analyst researches problem, plans solutions, recommends software and systems, and coordinates development to meet business or other requirements (wikipedia). System analyst is the most responsible person for the new system project management and therefore he should possess and behaves the following characteristics. The analyst should: Question about every aspect of current and new system. Assume that every thing is possible and do not accept such sort of statements, "This is a routine operation to perform such type of job in our organization". Pay intension to each and every single answer because each answer could generate many important questions related to problems of current system. Restructure his mind before the development of each new system and do not correlate with previously developed systems. Have excellent communication skills. Identify and translate the problem of current system. Generate the maximum solution of the problem. Explain the logic of his solutions. Learn from mistakes. Not be bias to the customer or the software house for which he/she is working. In developing a physical data flow diagram, an analyst must explore the process for more details. Maintain consistency between the processes. Follow meaningful leveling convention. Ensure that data flow diagram clarifies what is happening in the system. Always remember data flow diagram audience. Evaluate data flow diagram for correctness. The system analyst must be able to communicate in writing and orally. The analyst must easily get along with people. The analyst must be a good listener and be able to react to what people say. The analyst must be knowledgeable of technology. The analyst is not expected to know the intricacies of programming, but a decent general knowledge of concepts and terms is essential. The analyst must be knowledgeable of business. The analyst is not expected to be an expert in business but a decent understanding of the client's world is required.
References:
http://hubpages.com/hub/What-is-a-data-flow-diagram
http://www.about-knowledge.com/software-project-analysis-and-characteristics-of-an-analyst-and-types-of-analysis/
| |
| | | | Alvin Mark Cabeliño
Posts : 14
Points : 15
Join date : 2011-11-26
Age : 32
Location : Davao City
| | Subject: Re: Assignment 10 (Due: February 10, 2012, before 01:00pm) Fri Feb 10, 2012 3:57 pm | |
|
In connection with our previous assignment, we were asked about the characteristics does we, as analysts, examine when evaluating Data Flow Diagram quality. But before anything else, I would like to discuss first what is a data flow diagram, how to create DFD, and different types of DFD.
Purpose
A data flow diagram is a logical model of the flow of data through a system that shows how the system’s boundaries, processes, and data entities are logically related
Strengths, weaknesses, and limitations
A data flow diagram is an excellent tool for summarizing and organizing detailed information about a system’s boundaries, processes, and data entities, providing the analyst with a logical map of the system. Documenting the system’s boundaries by drawing a context diagram helps the analyst, the user, and the responsible managers visualize alternative high-level logical system designs. The elements of a data flow diagram lead directly into physical design, with processes suggesting programs and procedures, data flows suggesting composites, and data stores suggesting data entities, files, and databases.
Creating a data flow diagram is a process driven task. Consequently, it is relatively easy to overlook key data elements and composites. Balancing a data flow diagram verifies the model’s internal consistency, but does not necessarily reveal missing elements. Attempting to balance a significant logical model without appropriate software (such as CASE software) is at best difficult and can be misleading. Beginners and users often confuse data flow diagrams with process flowcharts.
When to use Data Flow Diagram
The DFD is an excellent communication tool for analysts to model processes and functional requirements. One of the primary tools of the structured analysis efforts of the 1970's it was developed and enhanced by the likes of Yourdon, McMenamin, Palmer, Gane and Sarson. It is still considered one of the best modeling techniques for eliciting and representing the processing requirements of a system.
Used effectively, it is a useful and easy to understand modeling tool. It has broad application and usability across most software development projects. It is easily integrated with data modeling, workflow modeling tools, and textual specs. Together with these, it provides analysts and developers with solid models and specs. Alone, however, it has limited usability. It is simple and easy to understand by users and can be easily extended and refined with further specification into a physical version for the design and development teams.
The different versions are Context Diagrams (Level 0), Partitioned Diagrams (single process only -- one level), Functionally decomposed, leveled sets of Data Flow Diagrams.
Principle for Creating Data Flow Diagrams
Therefore, the principle for creating a DFD is that one system may be disintegrated into subsystems, which in turn can be disintegrated into subsystems at a much lower level, and so on and so forth. Every subsystem in a DFD represents a process. In this process or activity the input data is processed. Processes cannot be decomposed after reaching a certain lower level. Each process in a DFD characterises an entire system. In a DFD system, data is introduced into the system from the external environment. Once entered the data flows between processes. And then the processed data is produced as an output or a result.
Create a Data Flow Diagram
Data flow diagrams can be used to provide a clear representation of any business function. The technique starts with an overall picture of the business and continues by analyzing each of the functional areas of interest. This analysis can be carried out to precisely the level of detail required. The technique exploits a method called top-down expansion to conduct the analysis in a targeted way.
| |
| | | | Sponsored content
| | Subject: Re: Assignment 10 (Due: February 10, 2012, before 01:00pm) | |
| |
| | | | | | Assignment 10 (Due: February 10, 2012, before 01:00pm) | |
|
Similar topics | |
|
Similar topics | |
| » Assignment 9 (Due: February 3, 2012, before 01:00pm)
» Assignment 11 (Due: February 17, 2012, before 01:00pm)
» Assignment 12 (Due: February 24, 2012, before 01:00pm)
» Assignment 6 (Due: December 23, 2011, before 01:00pm)
» Assignment 9 (Due: February 12, 2010, before 01:00pm)
|
| | Permissions in this forum: | You cannot reply to topics in this forum
| |
| |
| |